Audio-Assisted Tactile Reader
Project - Audio Tactile Reader
The project was done under the course COP 315 – An Embedded Design project, in IIT Delhi, under Prof. M. Balakrishnan in 2017. This course exists with the purpose to make projects that solve real life problems that could be faced by any section of the society. When we took up this course we were really not sure what we would end up doing in this course. We did not have any immediate idea in our minds (even after brainstorming) and were hoping that Prof. Balakrishnan would guide us to an idea. But, what we were sure of, was that we wanted to make a working project that could actually solve some problems.
We were a group of 6 individuals, all from the Computer Science Department who felt that they were tired of the theoretical knowledge and wanted to do something that was real and practical. The first meeting with Prof. Bala he introduced us to our mentor Ms. Ankita Gulati, who works in the ASSISTECH Lab in the Computer Science department. The initial project that we took consisted of a touchscreen device which would assist in tactile reading. The tactile map was supposed to be placed on the screen and on clicking in a certain region of the tactile, the tablet was supposed to play sounds related to the region.
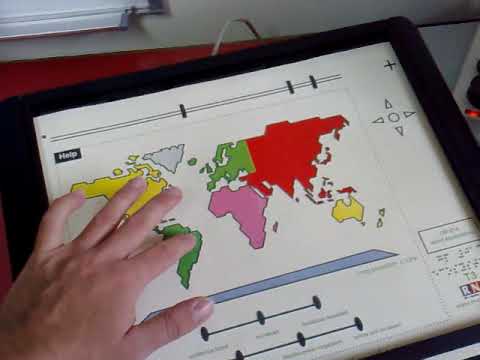
We had discussions regarding the project and realized that an Android App performing the same function would be more useful. It will remove the hardware component of the tablet and will also decrease its cost. Also since all of us were more software inclined, we felt that we would enjoy working on the app more.
The project was transformed into making an Android App that performed the task of playing an audio corresponding to the region of click on the tactile sheet. On research we realized that we could do that easily with color detection but the real problem was of data creation for these apps. In many blind schools someone had to manually create data storing the mappings of the regions to the corresponding audio. For this process they needed knowledge of specific software and it was usually tough and costly to find people with that knowledge. We decided to add a desktop component to the project.
First Idea of the Desktop IDE was very simple from the outside and we divided the task into three parts – Opening the SVG file(Every file needs to be converted to a SVG file before 3d printing tactile sheet), letting the user click on the desired face he wants to map data to and finally add the data to a folder so that it can be later uploaded to the online server as a book. We thought the Desktop IDE will be built smoothly because we had everything figured out. But that’s not how things work, do they?
Our first line of action was opening the SVG in a web browser, placing a transparent picture box above it and let the user click on the picture box. After detecting the click we were simply going to map the coordinate to an audio file. Of Course the primary purpose of the IDE which was to not make user manually select areas but automatically detect the polygon in which the point was located was defeated with this design. But we thought we will work on this when we reach the end. What we did not realize was that we were not going to reach the end anytime soon.
Our start took us more than two weeks because after doing a lot research and after asking a lot of questions on different tech websites (mainly stackoverflow), we found out that transparency of PictureBox in Visual Studio was just an illusion. When we set the PictureBox background to be transparent, It just took the color of the form as its background, which was in no way the transparency that we required.
If we put the PictureBox on background and Web Browser on front obviously the PictureBox will not detect any click. To add to the problems we discovered that there was no way to detect coordinates of a click on the Web Browser.
So we had to take a big detour in going from step-1 (viewing the SVG file) to step2 (detecting the user’s click). The only alternative we could think of was to draw the SVG by our own on the PictureBox. This way the user can see and click wherever he wants to while we keep the PictureBox on top. The PictureBox didn’t need to be transparent anymore. But a big problem with this solution was creating a library which will be able to read the SVG code and convert it into some data structure which we can draw on the PictureBox.
We spent another week or so just looking for this library hoping to find one so we don’t have to make our own. Reading through the SVG file tag by tag and reading through those commas or no commas since there is a flexibility in SVG syntax, making conditional statements for each ‘m’, ‘M’, ‘l’, ‘L’, ‘c’, ‘C’ etc. was going to be very hard. How do we know? Because we had to finally do it.
After searching for a library for a really long time, when we were exhausted and sort of sure that we will not be able to find one we started working on making our own library. Since we were making this library for our own use, we only explored the tags that we needed to and not all possible tags of SVGs. We knew our SVG files will be created by CorelDraw and thus we made a library specific to reading such SVG files and converting it into an array of points.
This detour however gave us a plus we realised later. Our earlier problem of automatically detecting a polygon when the user clicks anywhere on the screen which we were going to tackle “at the end” was solved because with our library made, now we had the power to convert the array into any data structure we wanted to and we could choose a data structure which included faces in it.
So we went straight to stackoverflow asking for different types of data structure that includes faces and which one would best suit our problem. Out of the different responses we got there, one stood out particularly because it was easy to implement, very easy to understand, didn’t take too much space and qualified the most important criteria which was that it got the most upvotes.
So that’s how we met DCEL for the first time. DCEL or Doubly Connected Edge List is a very simple data structure that stores faces, edges and vertices. A simple google search for DCEL will give you lecture slides from different institutes which you can use to get all the details required for implementing DCEL. One of these links is here.
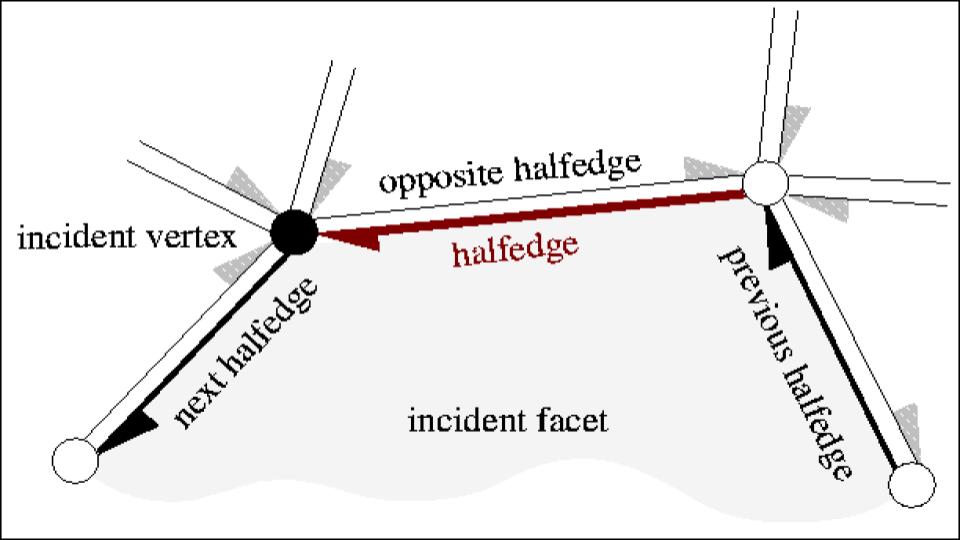
Converting the array of points we got from reading the SVG file using our library into DCEL was as basic as it can get. It was like simply another project of our Data Structures course. Now we started looking for an algorithm that given a point detects the face in which the point lies. The first algorithm we came across was trapezoidal map.
This algorithm while clearly very accurate was also looking very complex to implement. It would have required us to create another data structure of trapezoidal faces along with DCEL and make them work together to find the face in which the point lies. Also the algorithm made a basic assumption that the whole page was divided into closed polygons which would be a fair assumption to make in a Data Structures course project but not in our case.
That was when we were reminded we were not doing some simple project worth 5-10% credits of a 4 credit course but we were doing a whole 4 credit course. Our requirements were very specific and we felt that we had to make our own algorithm to find the required face.
Keeping in mind that we were already taking a detour here and the more time we waste in this process the more packed our future timeline will be and that we were working on a prototype here so we were working on a simpler range of SVGs. Also not to forget the algorithm that was in making wasn’t going to be tested or proved by many but just discussed between a few second yearites for a day or two at max before starting to implement it and so we came up with an algorithm.
We called it the Angle Method because it used the basic angle property true for any concave closed figure, that the anti clockwise angle formed by any side of the figure with a point inside the figure will always be less than 180 degrees. So for any closed figure for the which the point lies outside the figure there will always be at least one side such that the anti clockwise angle formed is greater than 180 degrees.
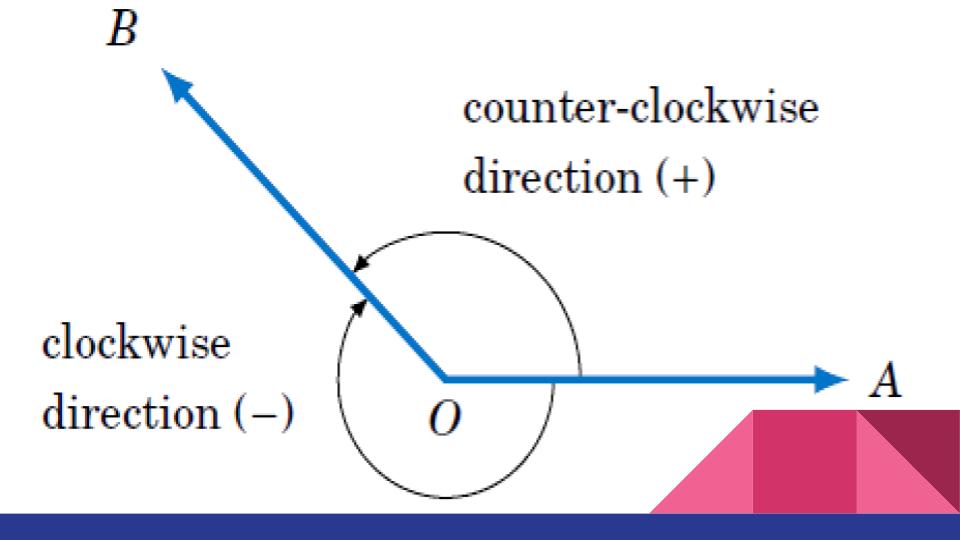
The biggest hole in our algorithm described above was one simple word that I used in the above sentence and that was “concave”. The algorithm didn’t work on convex figures. Since we were working on simple figures for our prototype we went ahead with the algorithm assuming we were not gonna encounter such problems. But as has happened before it did go along as we expected which gave us another new feature for the IDE.
We inserted all the basic features in the Desktop IDE and gave it the finishing touch that it needed to complete our Desktop IDE part. As the dooms day came closer we started working on our Demos. We were advised by Prof. Bala to make attractive and interesting demos for our project so that people in Open House will come to see our project and appreciate it.
While the Android team was a little behind schedule, the Desktop team started working on the Demos and while creating the demos, totally forgot that the Desktop worked only for concave figures. Turns out no good demos can be made just out of concave figures. Believe us, we tried.
So finally we had to do something to include those convex figures. Also we had one additional pending feature of letting user add manual polygons in the image. We saw a chance to kill two birds with a stone.
We developed the manual box insertion and integrated it with our IDE. After doing that we made Demos by making manual boxes outside convex figures to give them data. We gave the final finishing touch and created the data for the Android App team to use and waited for them to finish their work.
Meanwhile parallel to this work, Android team was also working very hard on their App.
The android team was pretty confused as to how to start the making of the app. The detection and identification of the coordinates was decided to be done using colour detection. After much discussion we started searching for already existing implementations of the colour detection in android. An open source github repository on mblobcolordetection was found that had implemented something similar. The code needed a lot of modification but the idea was in there and we all realised that it was possible to do what we actually wanted to.
The android team, with intermediate helpful inputs from the desktop team worked on the Color Blob detection part for almost 2-3 weeks. We had to input the colour to be detected in an HSV format. The HSV values were scaled to 0-100 (in terms of percentage) in the android code contrary to the default 0-255 values.
The initial app was able to detect the presence of the colour and on working on it for 2-3 days we were able to extract the coordinates of the Center of Mass of the coloured blob. Initially the colour that was being detected by the app had to be precise and the ranges for the same were later adjusted to allow scope for error due to lighting.
Then came a major hurdle, the question was, how to access the sound files stored in the memory card of the phone through the app?
So data is in the form of set of folders comprising of different books which can either be manually feed into the downloads folder of the Android Device, or it can be downloaded using the “Download Data” button available on the home screen of the android device. We earlier thought of uploading the data on the cloud server using IITD Cloud Baadal Servers, but that could not be implemented due to some logistical problems. The modified version of the Android App will surely fix this problem of transferring data from Desktop to the device. Once the data is downloaded, it can be accessed from inside the App.
The idea behind the app was to be able to read books which we decided to identify using QR codes. We manually generated QR codes according to the text mapping of numbers from 1-10 and stuck them on the top of the book covers. The identification of the page was done using the same idea, and we stuck the QR codes on top of each tactile sheet in a certain predefined area to prevent any sort of overlap with figures.
Even after being able to get all the above functions to work, there was one huge problem left. The problem of calibration. The coordinates that were being returned by the colour detection code were dependent on how wide the lens is and the height at which the camera is kept etc.
However the coordinates which were stored in the data were obviously fixed on some standard scale. After discussion with our mentor and amongst ourselves we decided to try and get the coordinates of the big square blocks on the corners of the QR code. Rahul and Rohit spent an entire week to figure that out, and i remember Rahul saying, “I need to write 2 lines of code, I know where I need to write it, but the compiler won’t give me access to that location”, had they been able to figure that out calibration would have been successful.
The problem was that, the QR code scanning was incorporated in our app as a predefined library and the function that accessed the coordinates required were “private” in their type and their type couldn’t be changed. That was because due to some reasons the Java file opened in Android studio as a locked file and we were not able to unlock it. Also going to the source code and separately opening the java file and editing it was also not possible because there were 100s of java files each compiled together in a some pattern which we could not decode.
We had to work around the problem and thought of a new and different way to calibrate. After much discussion we created a manual way to calibrate. We did our testing with the embossed sheet that was available from the Tactile lab. At the coordinates of the corner points of the domain of the SVG we printed small dots. These when embossed could be easily recognised as a dot on the corner. These were printed on the four corners of the sheet (later only three were used by us for calibration) and were tested upon. In the meanwhile, we had developed a program to transfer the coordinate obtained from the Camera to that of the SVG, given the calibrating coordinates. The techniques of, shifting and rotation of axes were used for the same. Finally when the above were incorporated together, it all worked. We were now able to generate sound on each click on the tactile sheet.
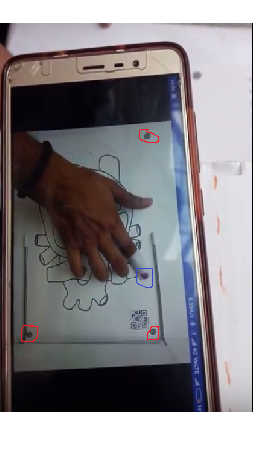
The red circles made indicate the three black dots we used for calibration. The blue circle represent the color on the top of the cap that is detected using mblob.
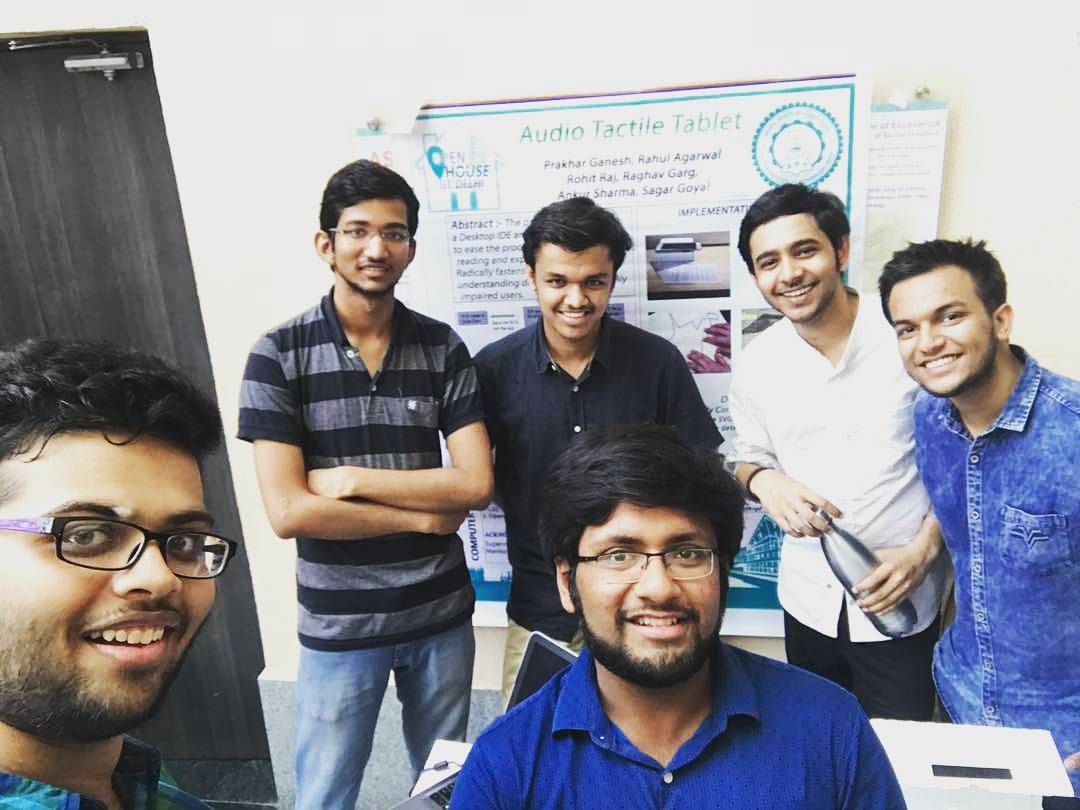
The Open House Demo:
After working for about 3 months on the IDE and the Android App, the day had arrived and we were too excited about it. We had to get a poster printed for the demo, and apparently the one we got was too small. So, taking some last minute decisions on the day before and including late night trips to Munirka we had somehow managed to get a full sized poster for our demonstration. We reached the SIT Building (the location of our demo, inside IIT Delhi) at about 9:15 and people started coming soon. The enthusiasm people had to watch IIT students develop interesting projects surely motivated us to work even harder.
Soon came a number blind children from one of the blind schools and we helped them recognise cartoon characters, and basic shapes through our project. Some of them liked the app so much that they wanted to play the sound again and again. Watching the app help them read and understand pictures realised how important this project could prove if it could be materialized industrially.
The external professors followed the children, they seemed pretty serious and kept asking us interesting questions about the application and the IDE. Some of the technicalities of the project were also discussed. After trying their hands on the demo themselves, they made us realise how the app could grow manifold if the manual calibration could be done automatic. They seemed pretty satisfied with what we had done and were hopeful of this project doing wonders for the blind people.
One of the suggestions that we got from almost everyone was that instead of making the user manually calibrate the page, we need to find some clever method of automatic calibration. One of the suggestions that came up was scanning for the black dots that we made in small areas at the locations where we would expect the corners of our page.
Another suggestion that came up was that instead of making the user create strings of data, just let the user give a web link and we can read from the link an convert into speech to any language that the user wants (using google translate).
Here are the links to Demos for Desktop IDE and Android App:
For now both the software are just prototypes and not available to everyone but we hope someone continues this project and takes this to the market.
Our code for both the software can be found here.
Find the Android apk here
Find the Desktop IDE here