Connectivity Dynamics of States & Parties on Twitter
Connectivity of politicians on Social Media
In this section, we discuss the political engagement of politicians in India on social media from January 2019 to November 2020. By political engagement, we refer to the retweets and mentions made by one politician to some other politician. Hence, each retweet or mention can be thought of as a weighted directed link from politician X to politician Y with edge weight Z (figure 1), denoting that X actively engages with Y on Twitter around Z number of times.

Methodology
A party (P1) of some state (S1) will comprise of many politicians belonging to that state-party group. Engagement of these politicians will, however, be distributed across the entire network to many other such state-party (S2-P2) groups, including themselves. We have defined the connectivity ratio or connectivity percentage in terms of the edges that leave from one group (S1-P1) to another group (S2-P2), all weighted by their strength of engagement (edge weight). Figure 2 visually shows how the metric has been computed.
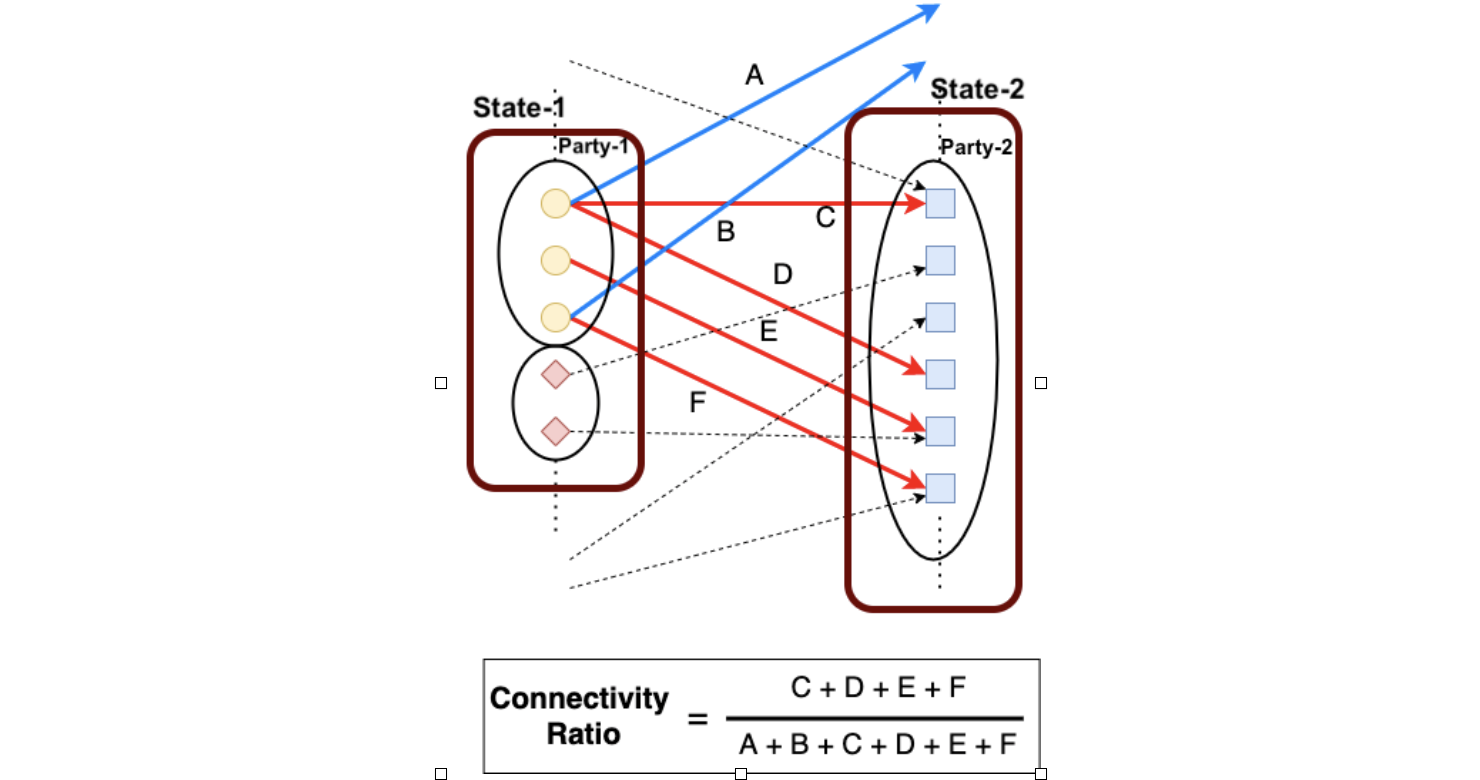
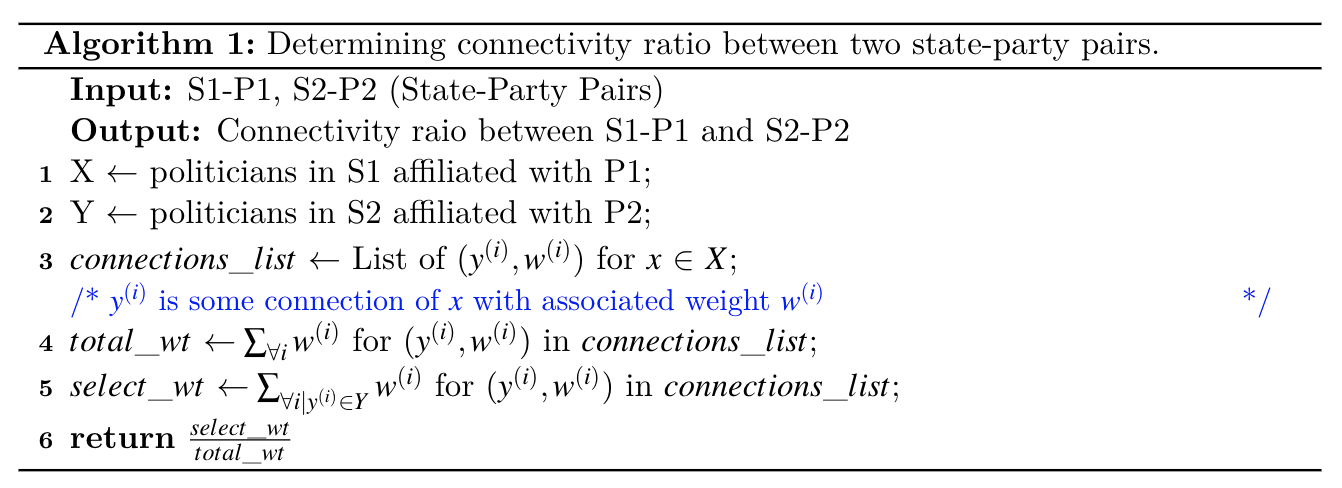
Algorithm 1 for computing this metric has been detailed below. In short, we capture the relative weight of the edges that fall from one group (X) to the other (Y) in comparison to the total weight leaving that group (X).
Terminology
Before diving into the connectivity dynamics at state or party, we will discuss the terms that will be broadly discussed throughout this section. Refer to figure 3.
Self-Connectivity
Connectivity of the state-party X to itself is termed as ‘self-connectivity’. ((S1, P1) \(\rightarrow\) (S1, P1))
Neighbourhood Connecitivity
Connectivity of X to its neighbouring states is called ‘Neighbourhood Connectivity’. ((S1, P1) \(\rightarrow\) ([‘Nbr-1’, ‘Nbr-2’, `Nbr-3’], P1))
From & To Center Connectivity
We have defined Delhi to be the ‘Center’ state since all the union ministers (Prime Minister and Council of Ministers), party leaders and important politicians operate from there. Connectivity of X to the ‘Center’ state ((S1, P1) -> (‘Delhi’, P1)) is termed as To Center Connectivity, while connectivity of the ‘Center’ to X is termed as From Center Connectivity ((‘Delhi’, P1) -> (S1, P1)).
State Connectivity
In this section, we talk about the connectivity of states in India and the engagement of the politicians in a given state with politicians of other states, center and the neighbouring states.
State to State Connectivity
Figure 4 denotes the important state to state relationships in terms of their political connectivity over the duration of 23 months (Jan, 2019 to Nov, 2020). For each state, we consider all the politicians from all the parties. Delhi state includes all the national party heads who operate from there, and as well as the Prime Minister’s Council of Ministers which includes the Cabinet Ministers, Ministers of States, etc. With Delhi acting as the Center, we can see the involvement of the states in establishing a significant amount of social media interactions with the Center.
Important non-center relationships between the states (shown in dark shade) also emerge out on social media, for example, Telangana and Andhra Pradesh, Kerala and Karnataka, Punjab and Haryana, etc. Such states may seem to connect on the basis of their shared culture, language, party presence and geography, amongst others. We also see that states like Uttar Pradesh, Karnataka and Maharashtra hold strong political relationships to other states, which shows their political importance as highlighted on social media.
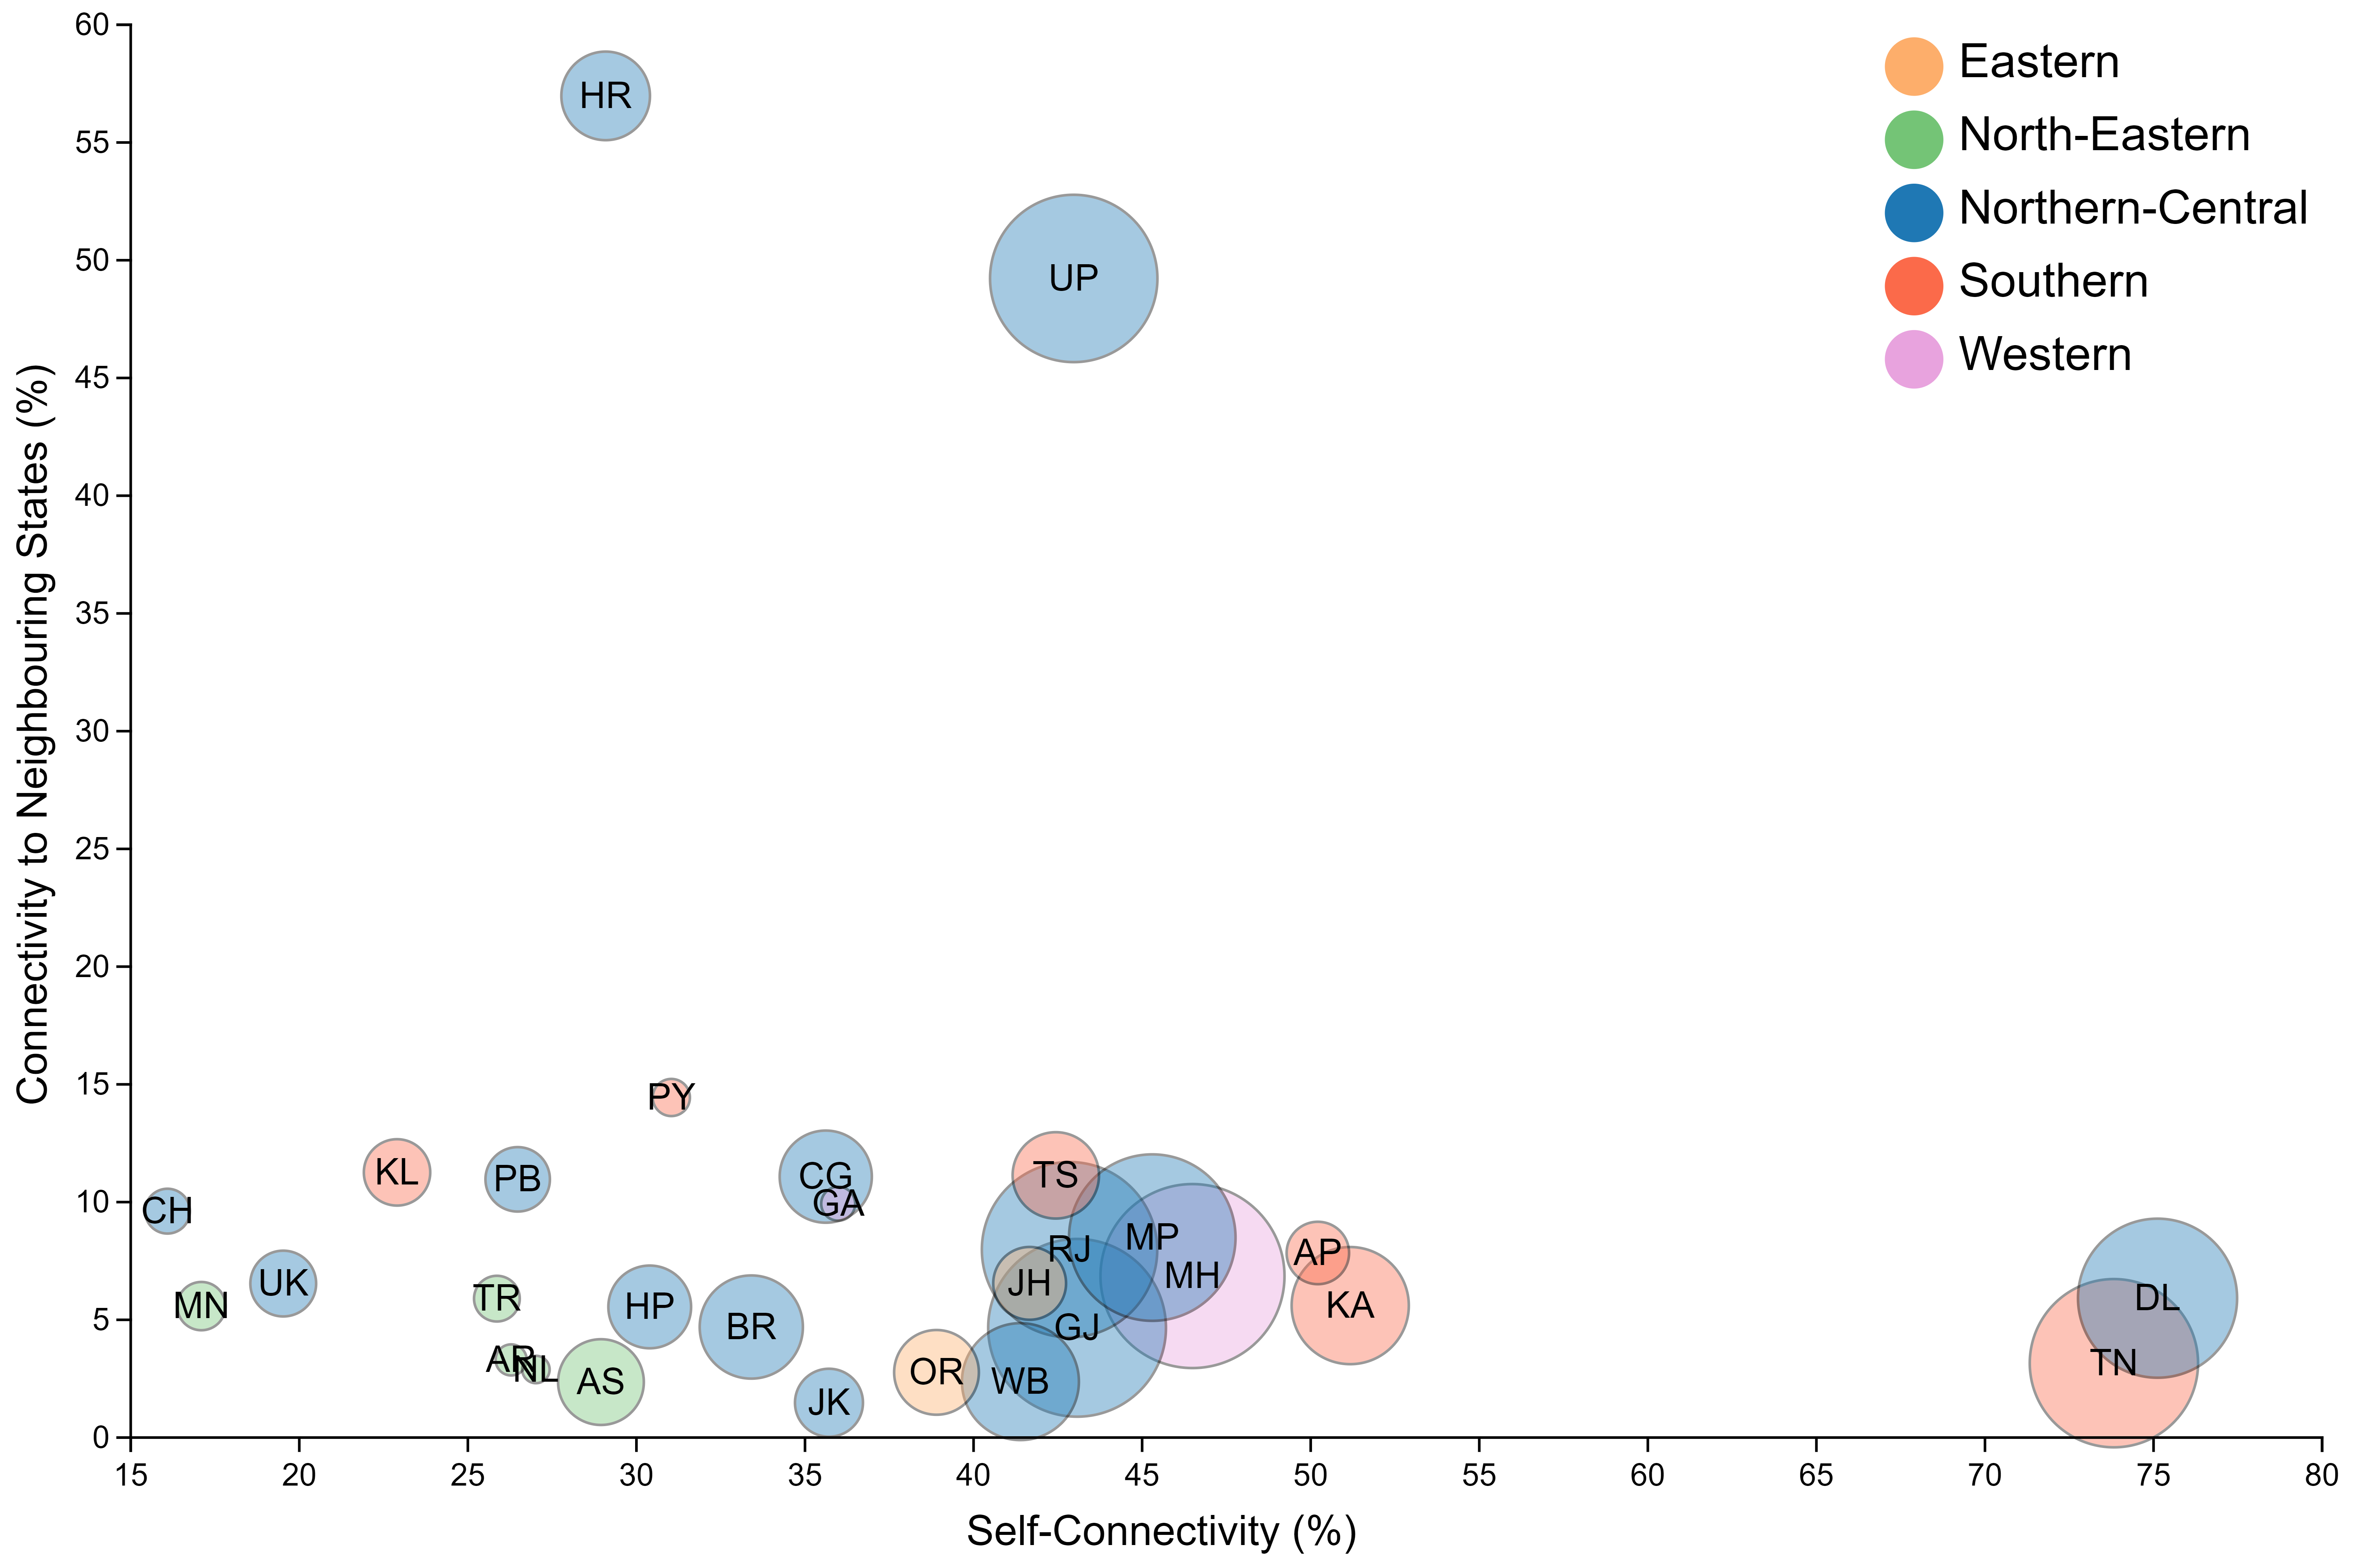
Figure 5 highlights the distribution of a state’s connectivity to itself, to the Center (Delhi), to its neighbouring states and to the rest of the country. We see that the most self-connected states are from the South (Tamil Nadu, Karnataka and Andhra Pradesh), and the least self-connected states are the UTs (Chandigarh) and the states from the North-East (Tripura, Manipur, Arunachal Pradesh). Interestingly, Kerala from the South has low self-connectivity which can due to the strong presence of INC there. Uttar Pradesh and Haryana have a strong neighbourhood connectivity due to the presence of Delhi as a neighbour. Apart from these two, states in the north are in general more connected to their neighbours than the ones in south or north-east. North-eastern states are, in fact, more politically engaged to the rest of the country than their immediate neighbours. Another trend that we see is that as the self-connectivity of states decreases, their connectivity to the center gradually increases. We further explore this trend further in the next section.
Role of Center
We see an inverse linear trend between a state’s connectivity to the center and to itself (figure 6). This is to say that when a state starts to get more and more politically engaged with itself, it systematically decreases its attention given to the center. We see a similar pattern for the parties also in the later sections of this chapter. Gujarat comes out as an outlier state in this case, i.e. it maintains a high self-connectivity while also engaging fairly well with the center. Some other outliers are north-eastern states which do not fit this pattern and are highlighted in green in the figure. While Arunachal Pradesh (AR) and Assam (AS) engage more with the center than Manipur (MN), Tripura (TR) and Nagaland (NL), the former group manages to stay better self-connected than the latter. As mentioned earlier, strongly self-connected states are from the South which are Tamil Nadu (TN), Andhra Pradesh (AP), Karnataka (KA) and Telangana (TS). In this figure, the bubble size denotes the number of politicians in each state. We notice that the states with high self-connectivities usually have a large set of politicians, while states with weak political representations seems to engage more with politicians outside the state, and more preferably, the center.
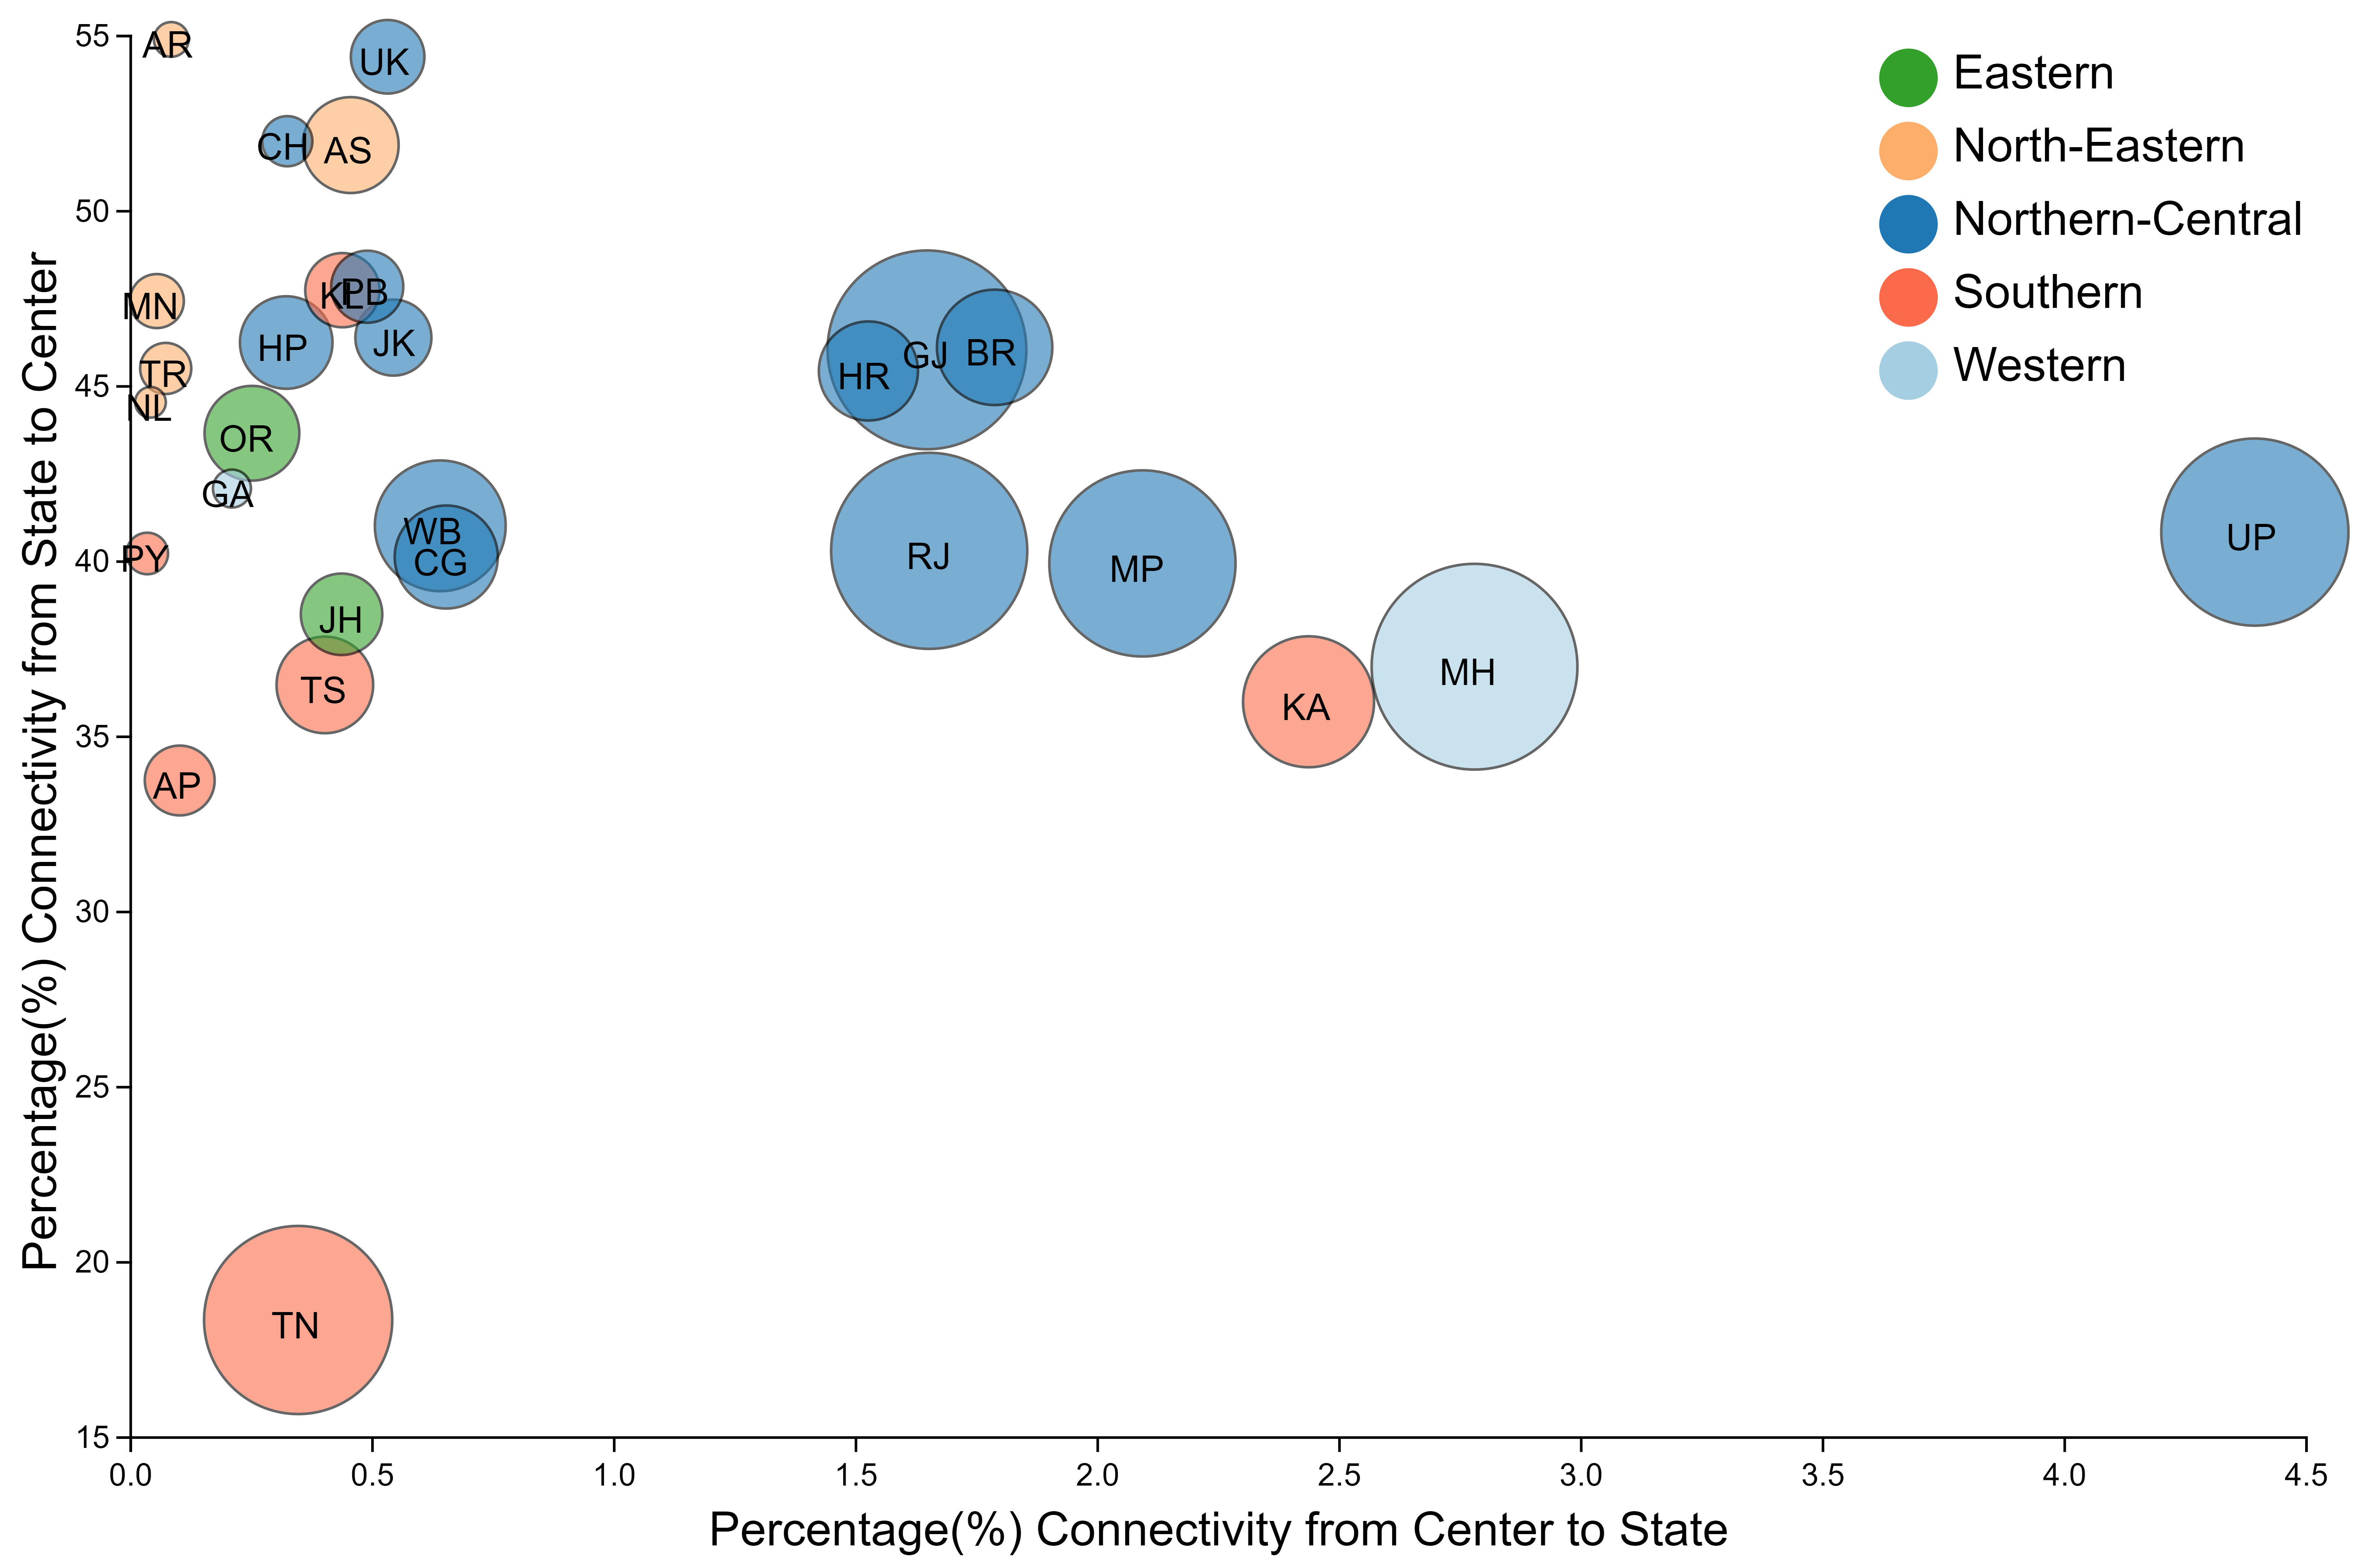
Figure 7 measures this disparity of the role played by center, and more specifically, it highlights the states that get more engagement from the center with respect to their engagement to the center. While states like Rajasthan (RJ), Madhya Pradesh (MP), Karnataka (KA), Maharashtra (MH) and Uttar Pradesh (UP) provide roughly the same engagement to the center, only UP gets preferentially the most attention from the center. This can be because UP, being a BJP ruled state, has been a hug of huge political attention from the BJP-ruled center after Hathras and Ram Mandir inauguration. We see most of the states that receive the most attention from the center are from the northern-central belt, which includes states like UP, MP, Rajasthan, Gujarat, Bihar and Haryana. Maharashtra received a similar attention from the center after state legislative assembly elections in late 2019, and the death case of Sushant Singh Rajput (SSR). Tamil Nadu (TN), being a strongly self-connected state, didn’t engage much with the center and nor did it receive any attention from the center. North-Eastern states engage a lot to the center, but do not receive any attention from the center. Similarly, almost all southern states (except Karnataka) receive low attention from the center.
Engagement with a State
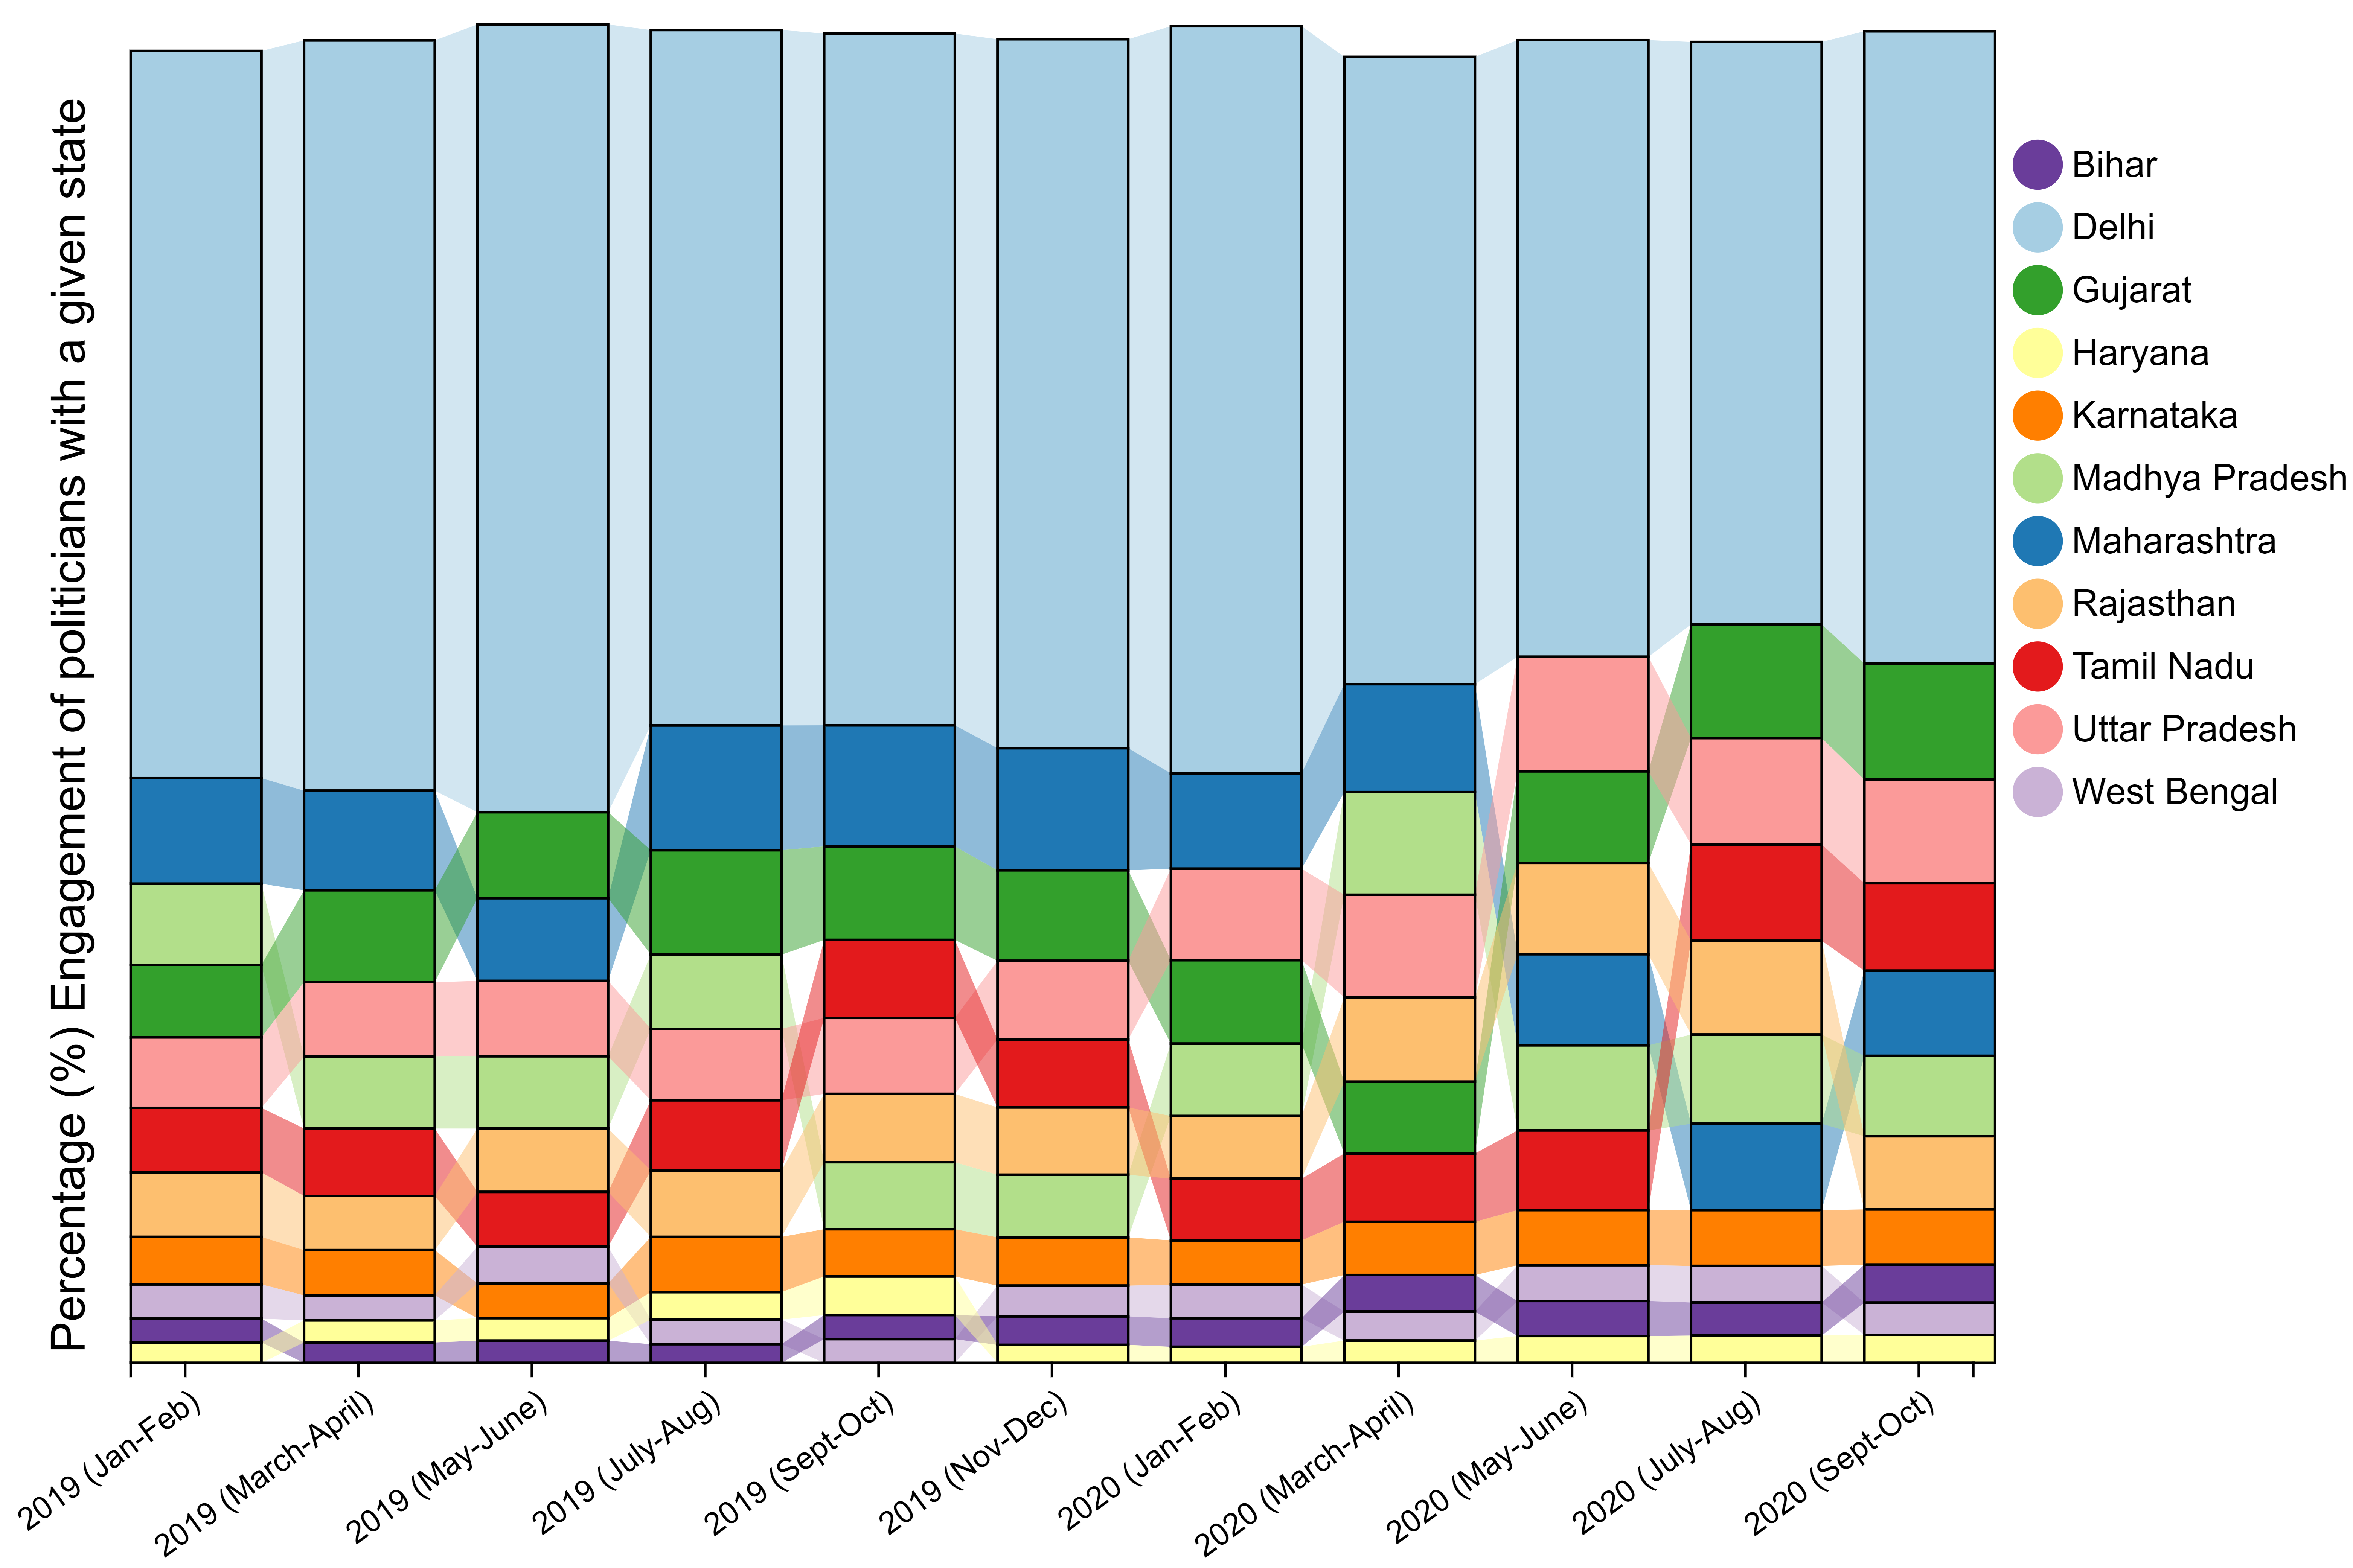
Figure 8 shows the engagement with a particular state by all the politicians in the country. The most engaged states by Indian politicians include Delhi, Maharashtra, Uttar Pradesh and Gujarat. Maharashtra occupies a significant share of political attention in India in 2019 during Lok Sabha and Legislative Assembly Elections. Rajasthan received the major attraction in May-June 2020 over the claims by the CM against BJP making poaching attempts against its MLAs. UP remained in the limelight in the second-half of 2020 period after Hathras case and Ram Mandir inauguration. It is interesting to see that only a limited number of politically active states receive attention in the Indian politics, and most of the other states are often left ignored without receiving any much engagement on social media.
Self and Neighbourhood Connectivity
Figure 9 shows the relationship between the connectivity of a state with its neighbours and the connectivity within itself. Haryana and Uttar Pradesh tends to be strongly engaged with their neighbours because of Delhi, and stands as outliers in the graphs.
Party Connectivity
In this section, we talk about the connectivity of parties in India and the engagement of the politicians in a given party with politicians of other parties, BJP, INC and other parties.
Party to Party Connectivity
The cultural and regional diversity of India resulted in the creation of many regional parties over the years like TDP, AITC, DMK, etc. As recognised by the Election Commission of India, we have six national parties - Indian National Party (INC), Bharatiya Janta Party (BJP), Communist Party of India (CPI), Communist Party of India - Marxist (CPIM), Nationalist Congress Party (NCP) and Bahujan Samaj Party (BSP). Amongst there, INC and BJP are the top national parties with BJP being the ruling party since 2014, and the INC being the opposition party in the parliament. Politicians of one party can engage with the politicians of another party during election campaigns showing support for the alliance party or by criticising the leaders for the opposing parties. Sometimes national and state level issues become an important subjects for politicians to target or support each other on social media. Since 2019, we have seen a large number of national events like Citizenship Amendment Act (CAA), Sushant Singh Rajput Death Case, Removal of Article 370 that grants special status to Jammu & Kashmir, Delhi Riots, COVID-19 crisis, and several key legislative assembly elections of Delhi, Maharashtra, Haryana and Jharkhand.
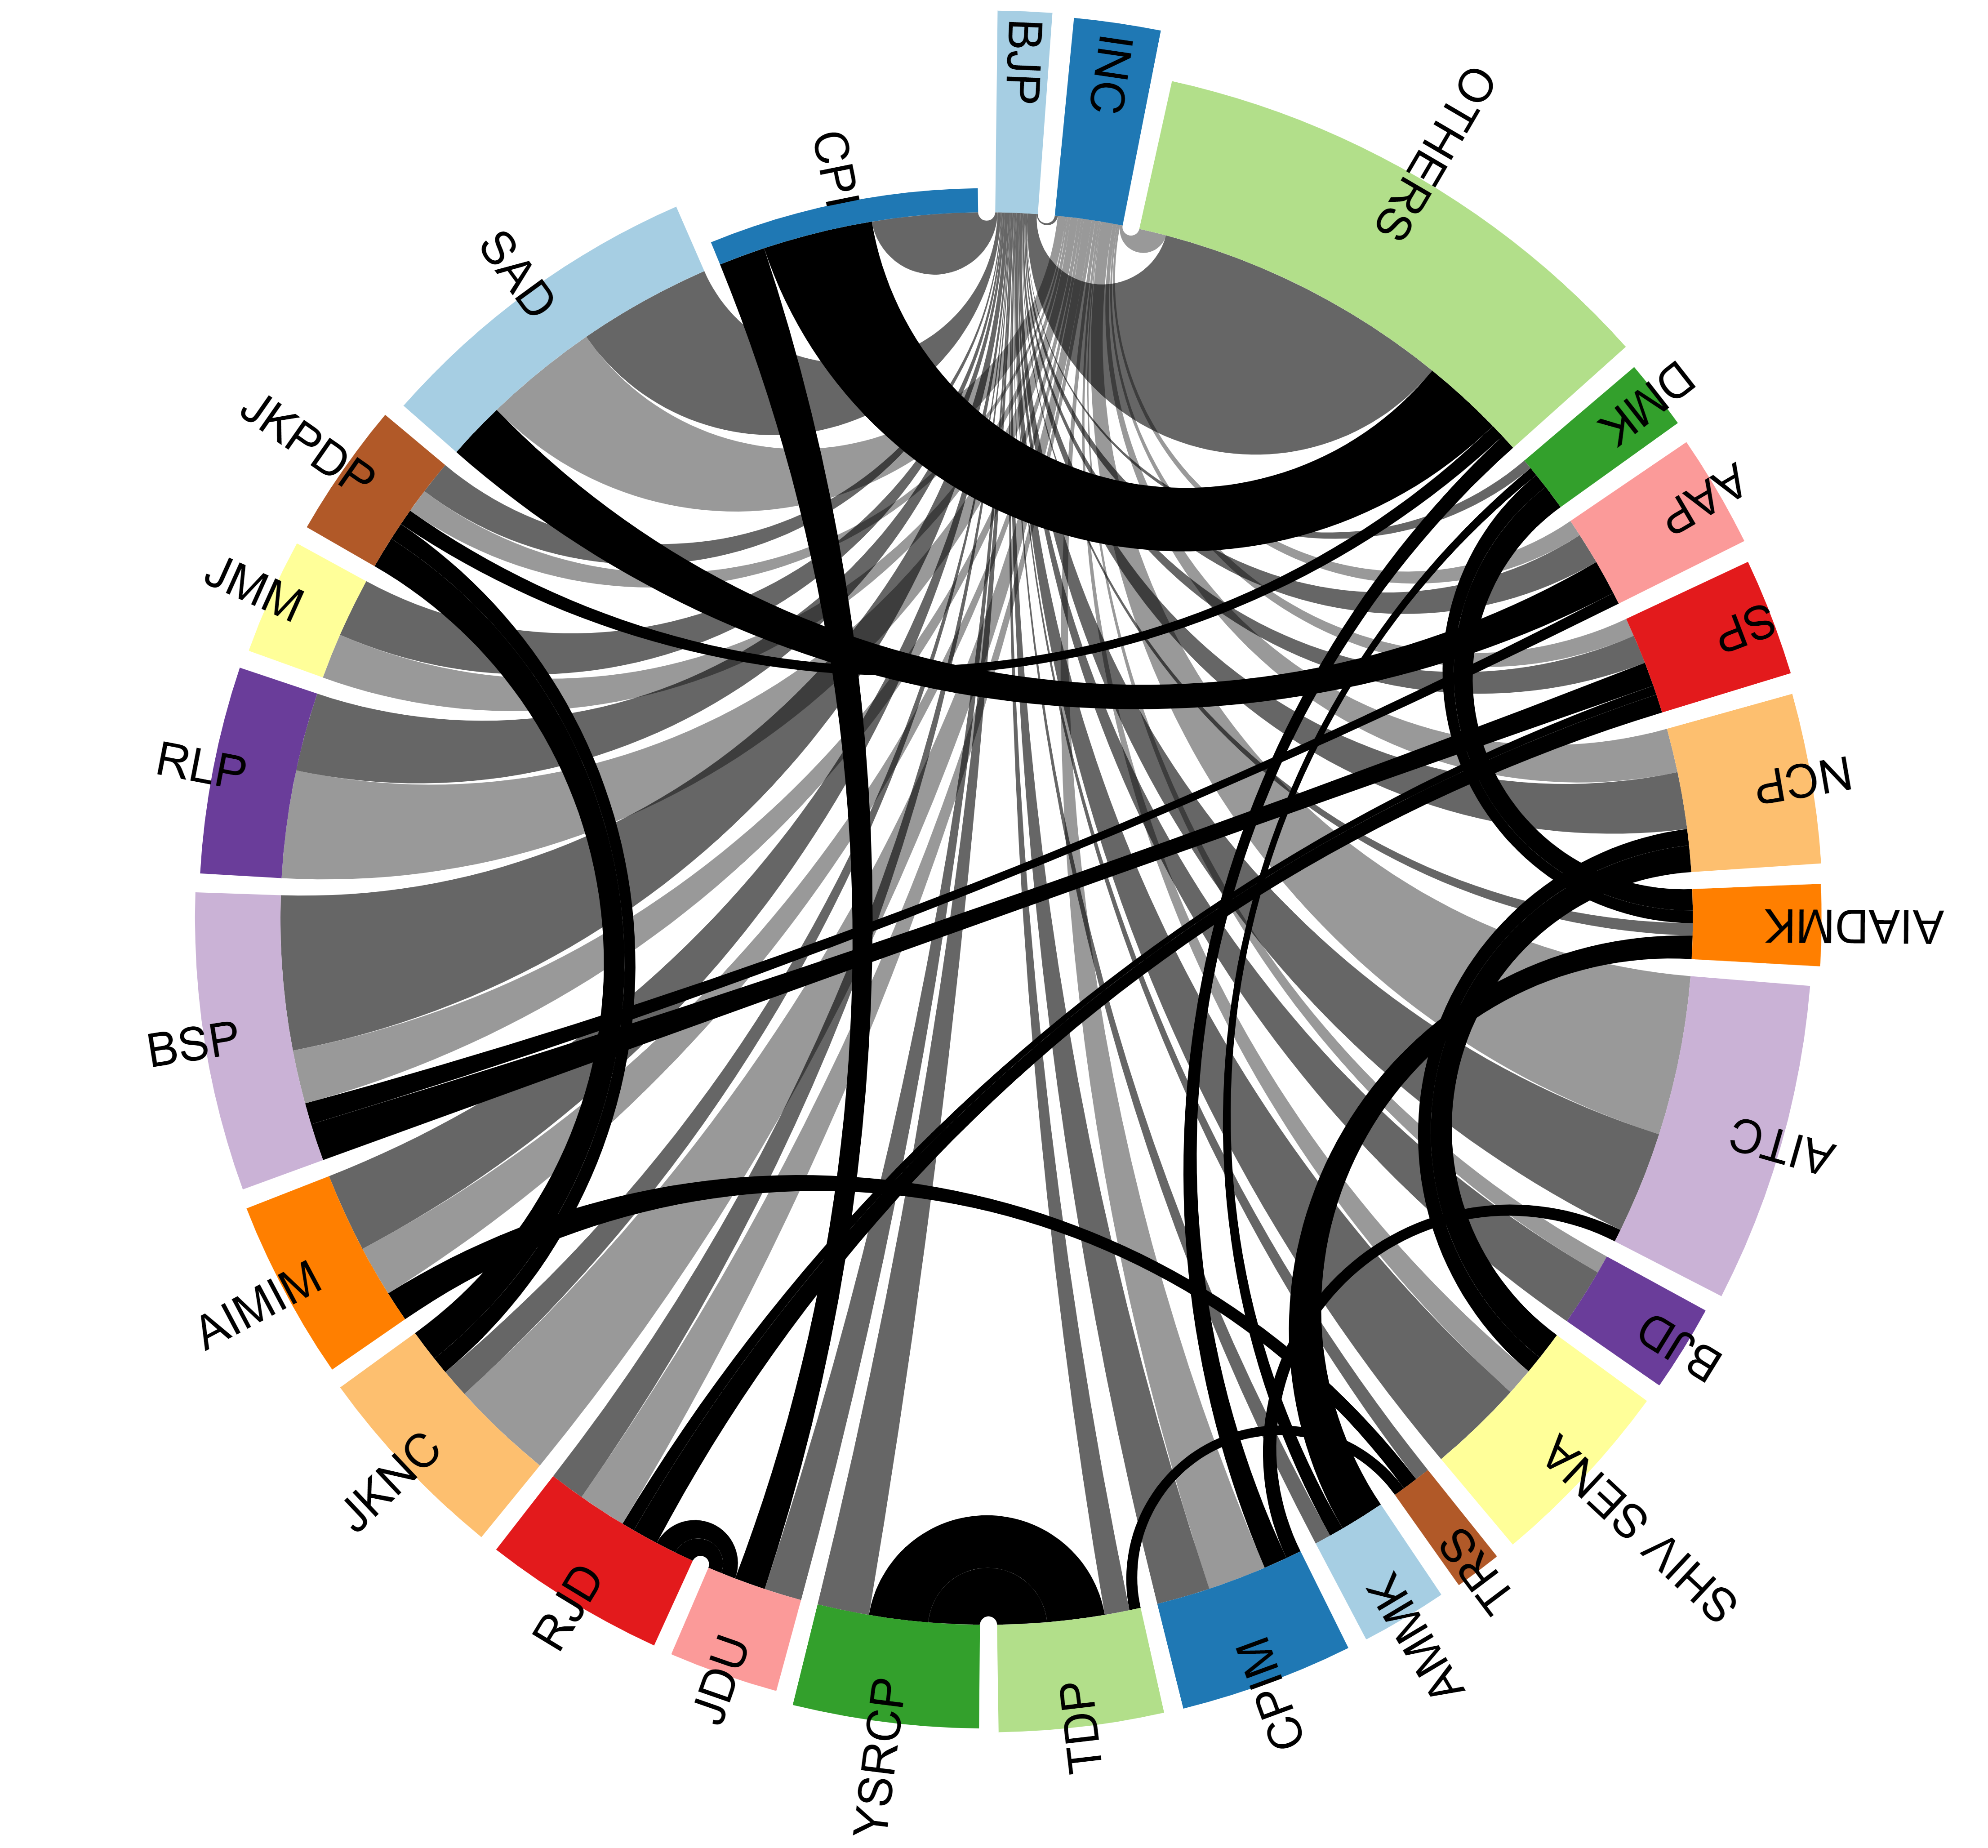
As per the figure 10, imporant party relationships on Twitter based on the presence within a state includes AIADMK-DMK (Tamil Nadu), Shiv Sena-NCP (Maharashtra), TRS-TDP-YSRCP (Andhra Pradesh-Telangana), JKNC-JKPDP (Jammu & Kashmir), RJD-JDU (Bihar), BSP-SP (Uttar Pradesh), etc. Some cross-state relationships like SAD-AAP (growing presence of AAP in Punjab), RJD-SP, and JDU-CPI, are also visible on social media. We see that a significant engagement is being driven to and lead by the top national parties i.e. BJP and INC. Many key regional (AAP, Shiv Sena, AITC, etc) and national parties (BSP, NCP, CPIM, etc) are directly involved in online engagement with the leaders of these parties.
From figure 11, we see that the most of the parties (national or regional) are self-connected on social media i.e. party people more tend to retweet or mention the leaders of the same party. This can point towards an interesting pattern in the retweet behavior of politicians which is largely driven by the party affiliation, and also shows more focus of the party leaders in supporting their own members, instead of targeting the members of other parties. Most self connected regional parties are from the south which includes TRS, DMK, AIADMK, AMMK and BJD, while the least self-connected regional parties are from the north which includes SAD, BSP, AITC, JKNC, etc. Both the top national parties (BJP and INC) also display a high level of self-engagement. Some parties like AAP, Shiv Sena, JDU, BSP and NCP, engage more with the BJP than with INC. Other parties like AITC, RJD, JKNC and RLP are more closer to the INC. However, we alse notice some parties like SAD and CPIM that are equally active in engaging with both the parties.
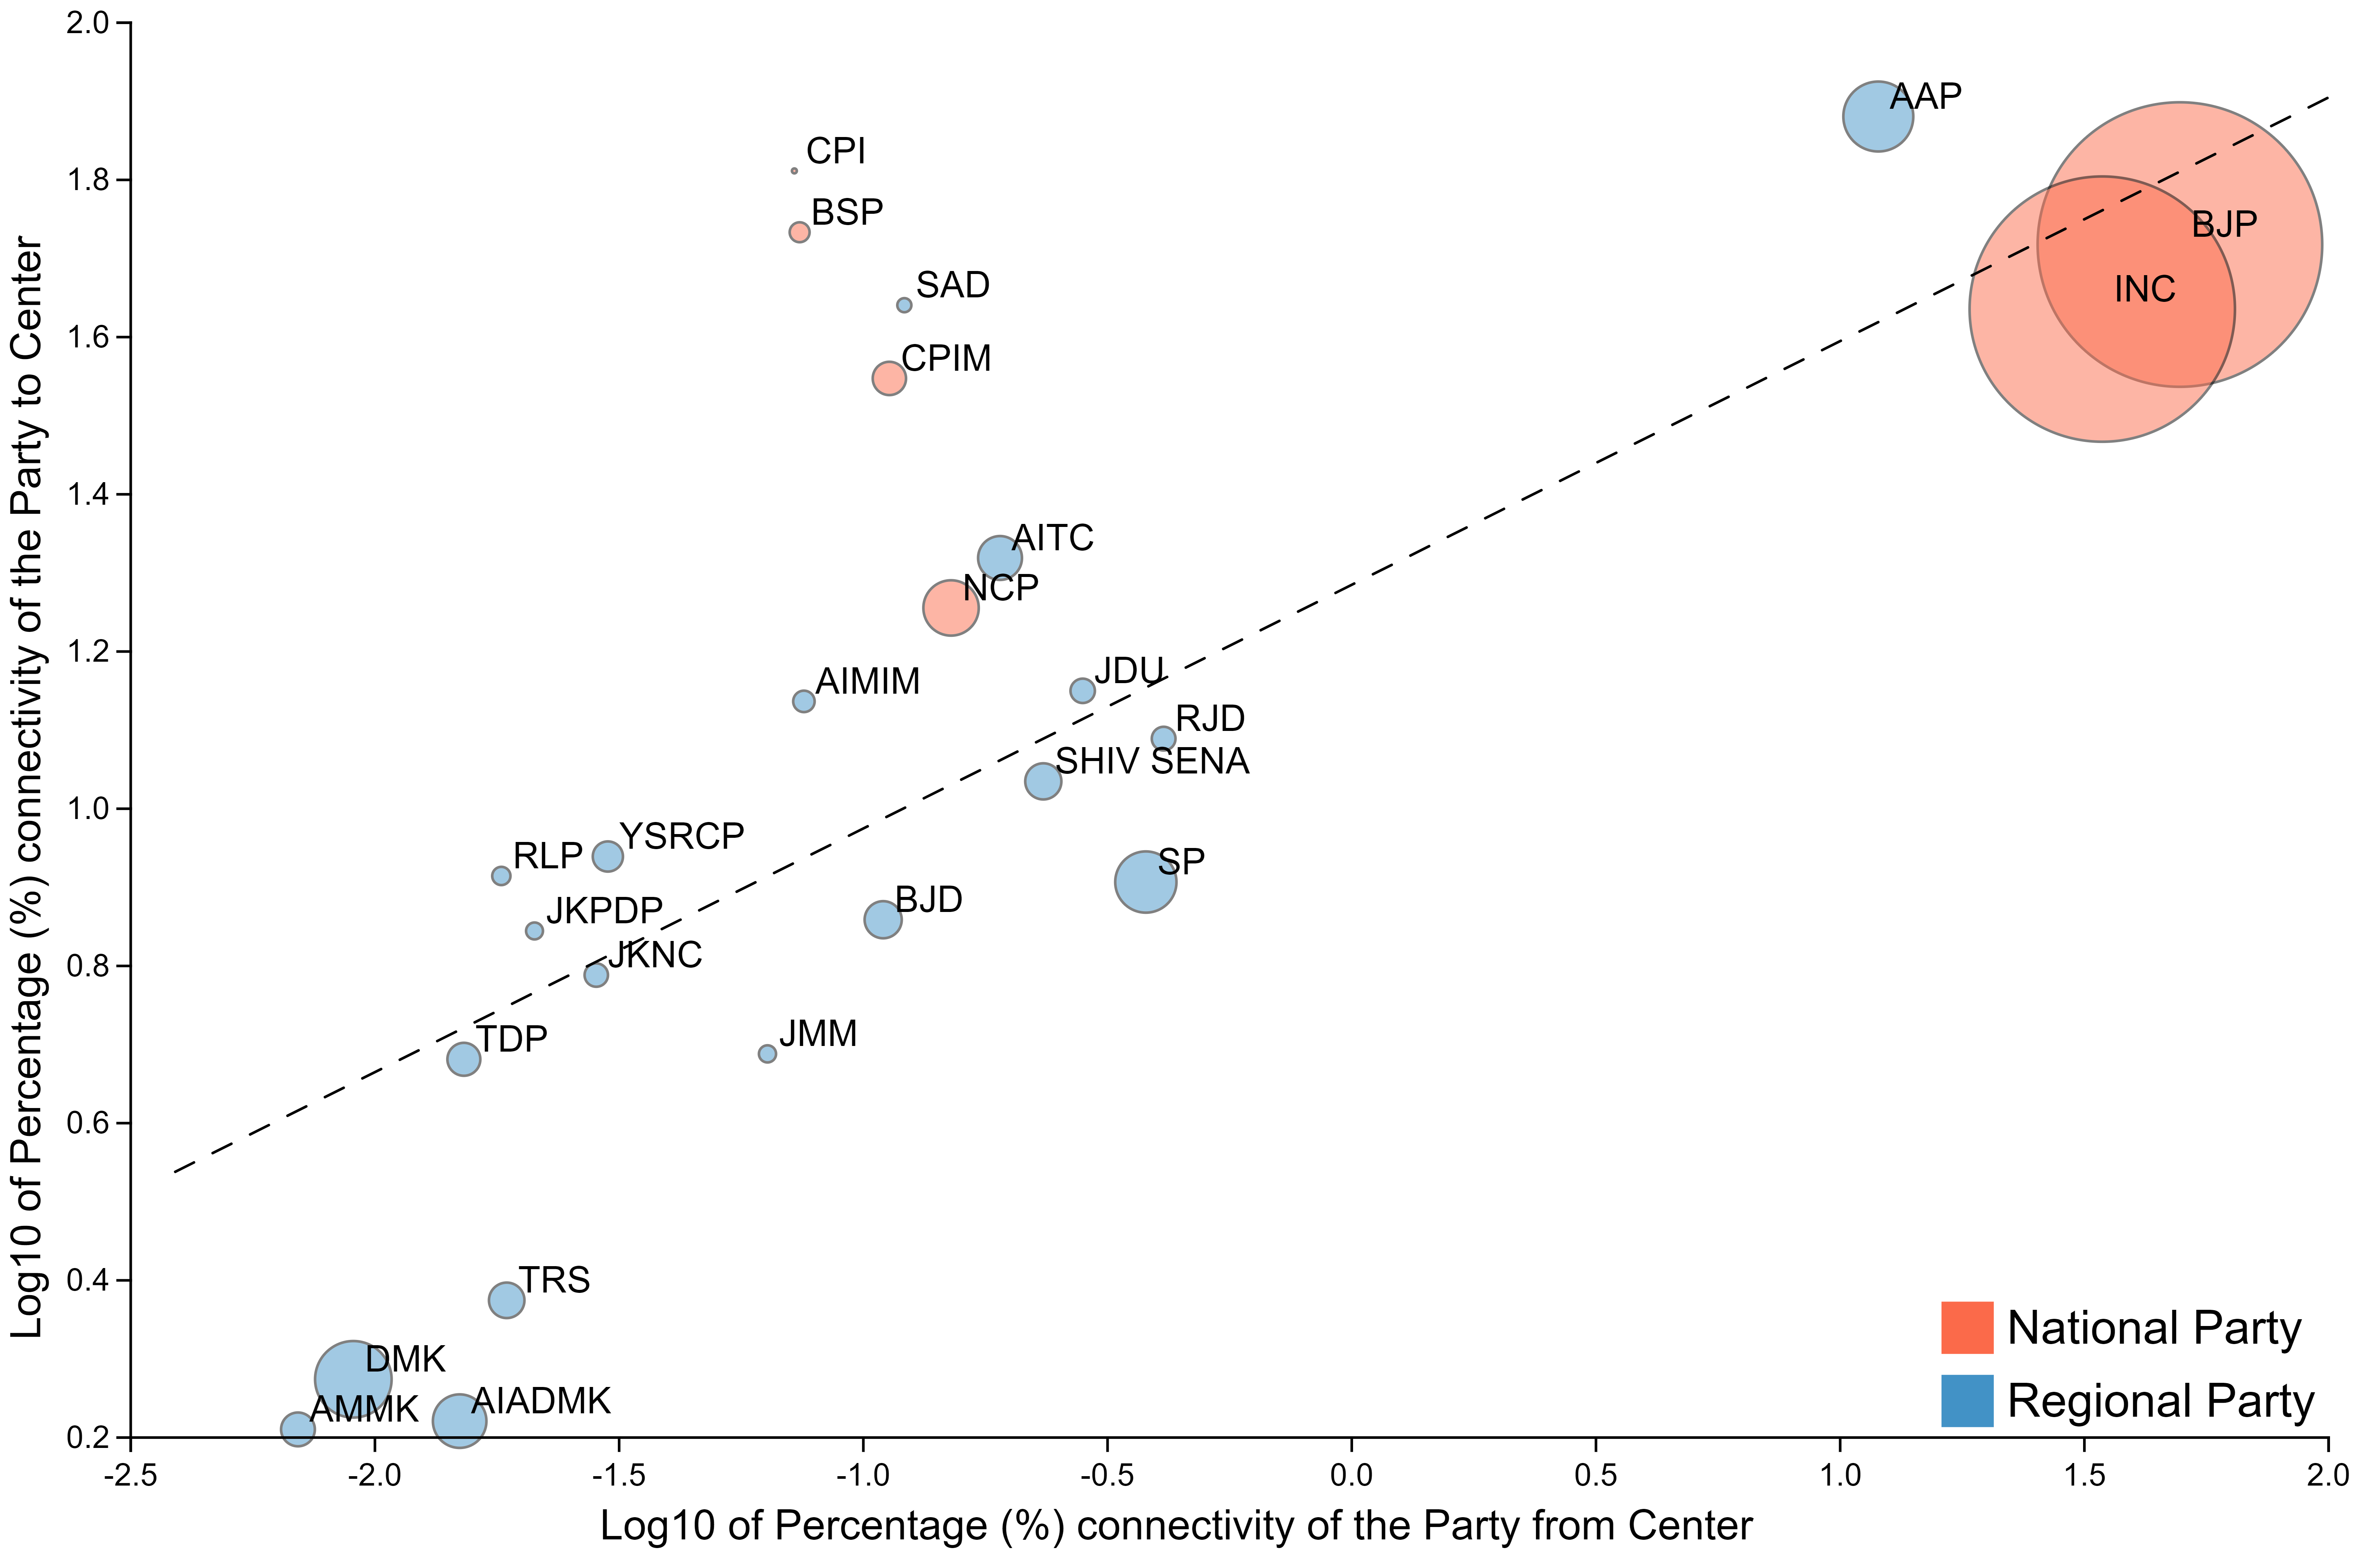
We notice the decreasing trend in figure 12 that as a party starts engaging more with national parties (BJP/INC), its engagement with the leaders of its own party decreases. Some parties like TDP, AIMIM, YSRCP, SAD and BSP, do not follow this trend and are considered to be outliers. For these parties, a significant share of their engagement is drawn to other regional parties too, besides BJP, INC and their own self.
Within a state, however, we find an interesting pattern in self-connectivities of parties as per the figure 13. We show the value of self-connectivity of a party within a state and compare the differences across various national and regional parties for each state. We see that for most states in India, a regional party is more cohesive in terms of its engagement strategy and is more strongly connected than any national party (BJP or INC here) within that state. Party with the strongest effect of regional party is in Tamil Nadu, Telangana, Odisha, Jammu & Kashmir and West Bengal, amongst others. These regional parties engage in their own regional language on social media with more focus on the state issues than the national issues. However, on the other hand, states like Delhi, Gujarat, Maharashtra, Madhya Pradesh, Himachal Pradesh, etc show a stronger presence of BJP or INC than regional parties.
Figure 14 shows this spread of dominance in self-connectivity of regional and national parties. Many of these states (in red) are strong BJP or INC ruled parties with no space left for regional parties to emerge. This map of India shows the strong emergence and cohesive nature of engagement followed by regional parties across the country, highlighting the need of such parties to cater regional differences. It also shows that national parties like BJP or INC with a strong nationwide representation throughout the country are still dominant in their connectedness at a state level too, highlighting the existing federalism in the country.
Role of Center
From figure 15, we see that BJP and INC receive the most engagement from the Delhi (center) politicians. AAP, being primarily active in Delhi, also receive a high degree of engagement. On the other hand, parties with strong presence in South India including TRS, DMK, AMMK, TDP and AIADMK, show lower connectivity with the centre, and vice versa. Some other outlier parties that do not get much attention from the center even after significant involvement are CPI, BSP, SAD and CPIM. Geography of the states, political alliance and connections to the ruling party (BJP) that sits at the Center can possibly affect the way Center chooses to interact preferentially more with one party than the other.
Engagement with a Party
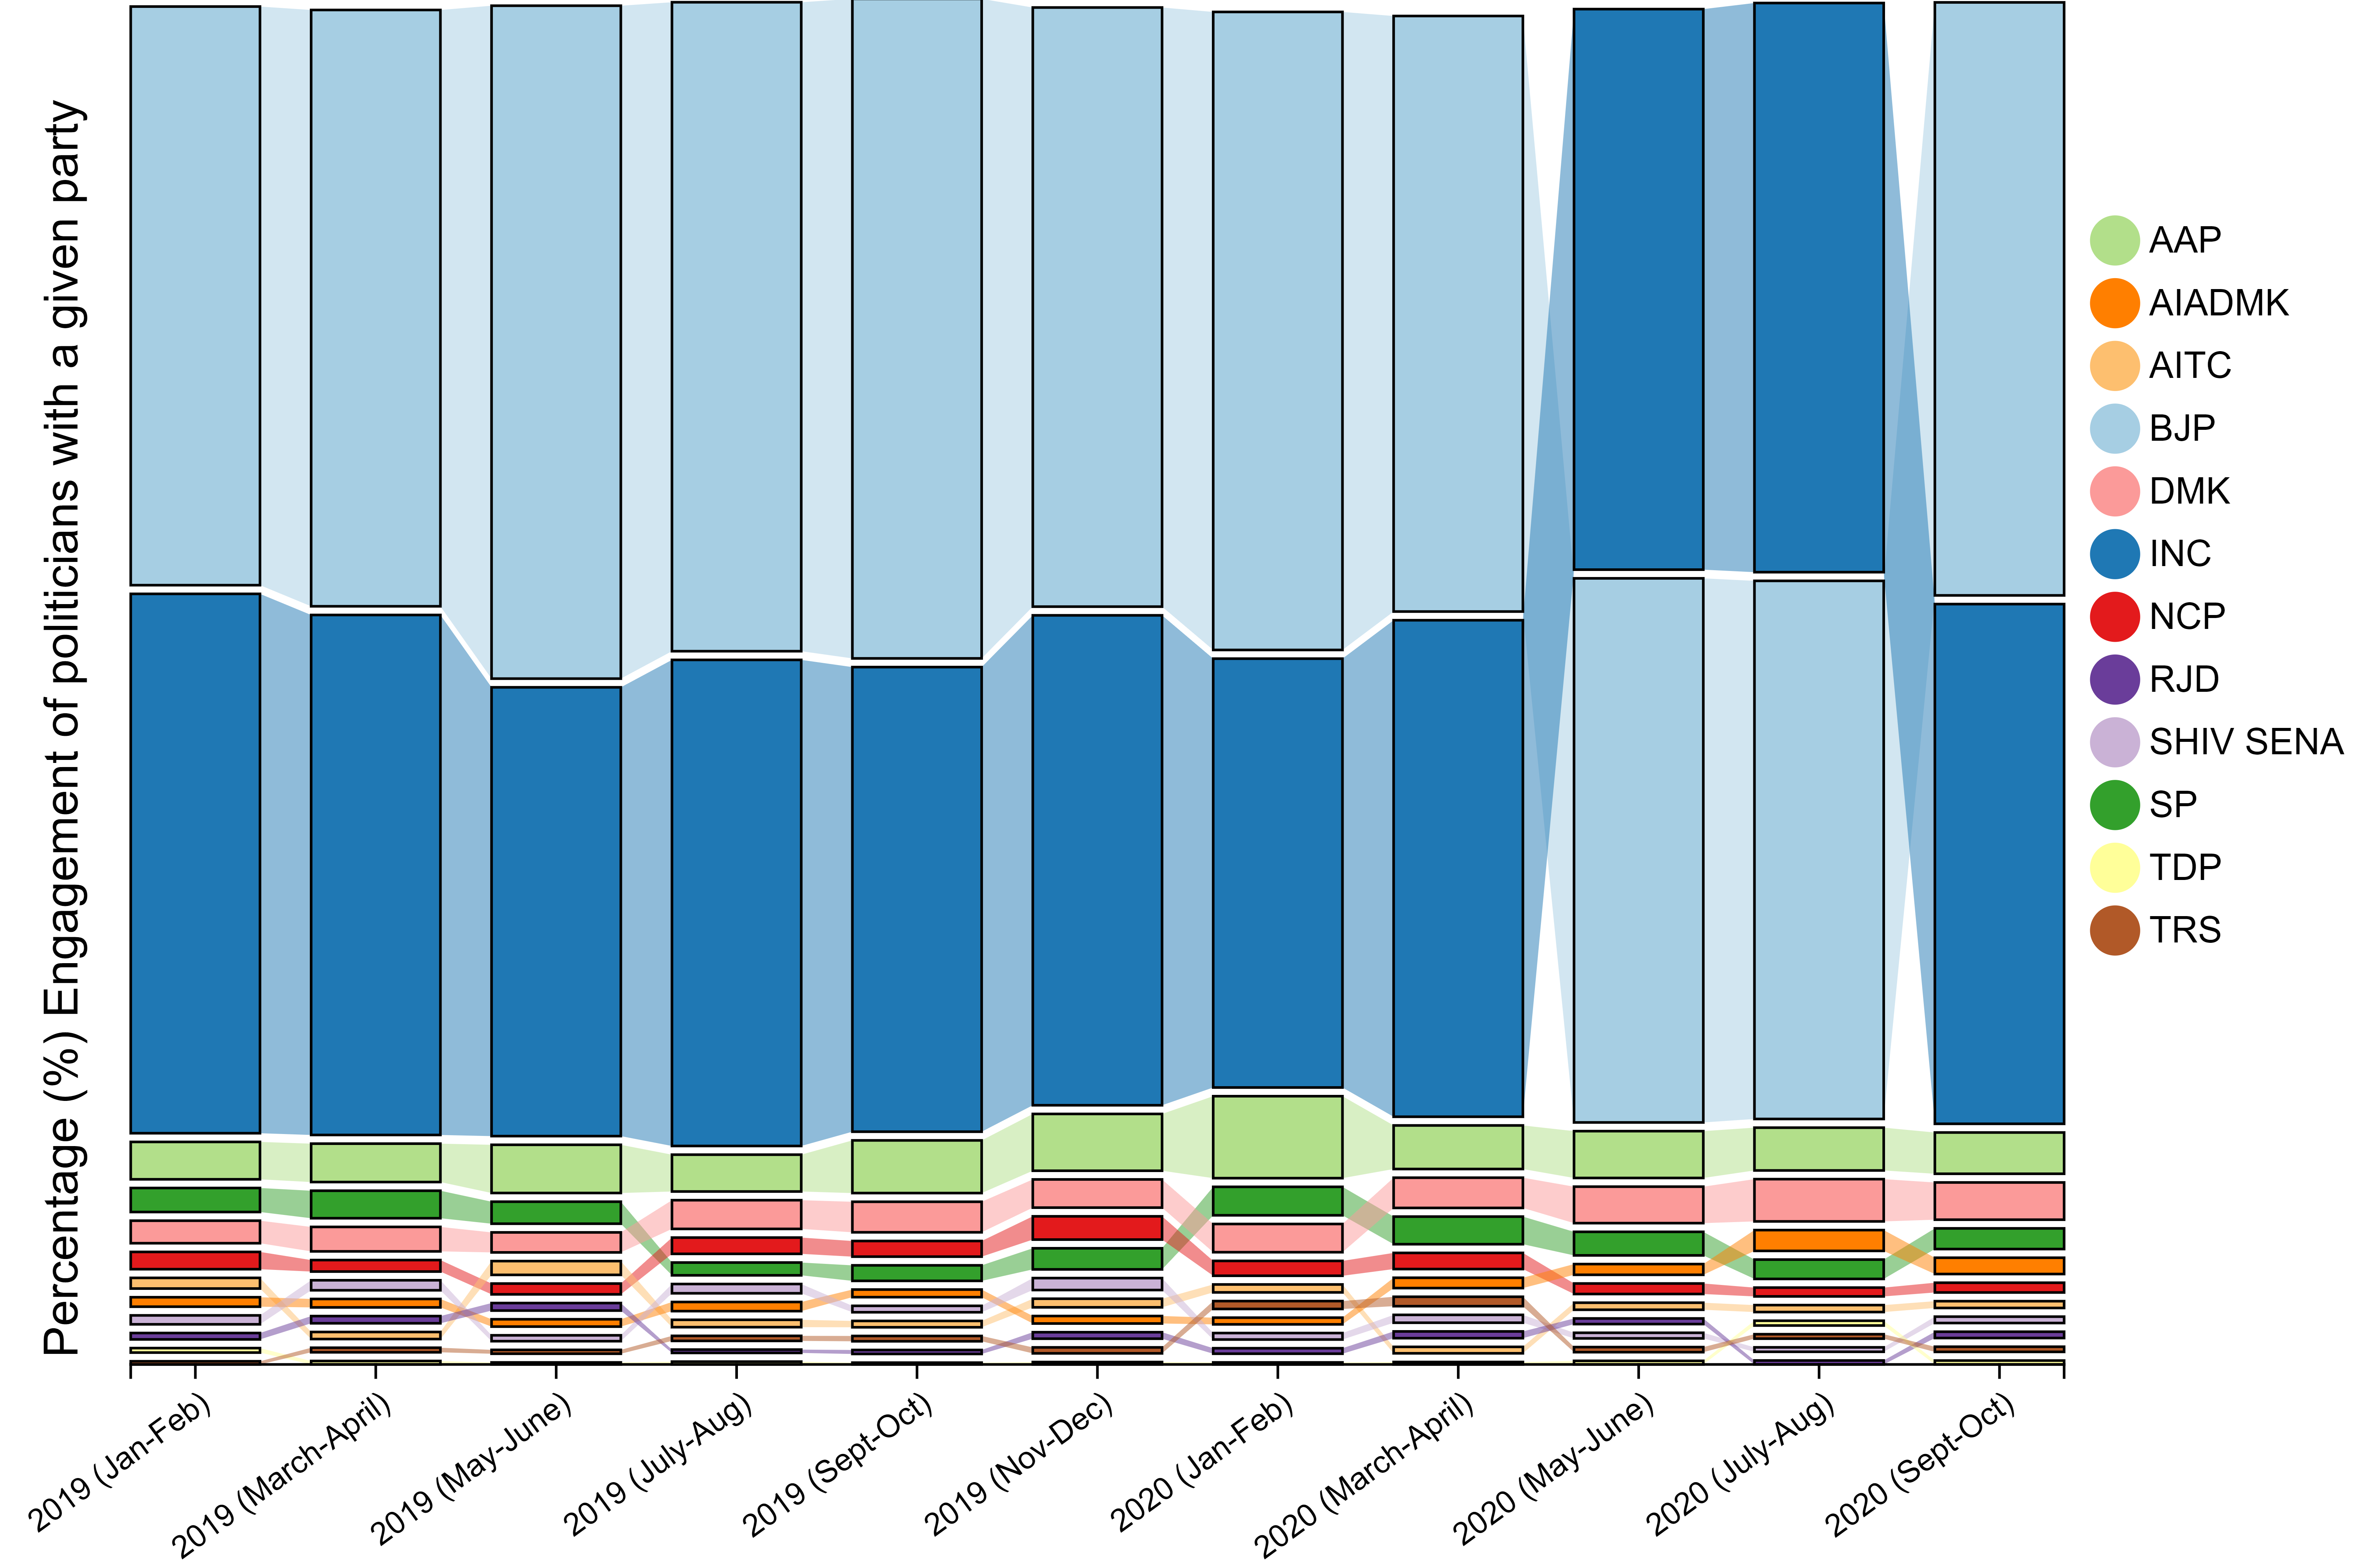
We also see the connectivity of politicians with parties in India on a temporal basis in figure 16. BJP & INC are clearly the most engaged parties on Twitter by Indian politicians. We see the peak in engagement to the BJP around 2019 May-June which is when the Lok Sabha elections took place, and BJP was strongly campaigning on social media with reliance on PM Narendra Modi, and Home Minister Amit Shah. INC was the most engaged party on Twitter from May to August 2020. AAP turns out to be the 3rd most politically engaged party after BJP and INC, and its peak attention came when the Delhi elections took place in February 2020. All other parties do not receive much interaction as compared to these three, and the span of engagement given to such parties is highly variable with temporal shifts.
Conclusion
In conclusion, we notice the extent of interaction between different states and parties, and their connectivity within themselves and to the Center. We notice key relationships in temporal engagement to a state or party, and we discuss various factors and metrics in capturing the same.