Understanding the political dialogue on Twitter - India & US
This work is currently under review at ECIR 2021.
Abstract
Understanding political discourse is a challenging research problem since it’s hard to tag and identify which politicians are talking about which topics. In this paper, we propose to use representation learning as a window into the political dialogue on social media through the tweets authored by politicians on Twitter. Our primary question in this paper is to understand whether political affiliation is the sole driver of what a politician writes on social media. To this end, we employ representation learning to embed politicians based on their tweets to model which politicians’ author similar content, and also propose a novel embedding method to improve some of the shortcomings of the existing methods. The learnt politician embeddings further demonstrate that for both the USA and India, political affiliation is not the only primary driver of what politicians write on Twitter but it is also influenced by their geography. Through our research, we want to highlight that information retrieval methods, such as representation learning, can be used in examining important social and political issues.
Proposed Method
The learning setting of the proposed model is such that given a politician and a tweet they have written, predict `K’ sequence words from the tweet with the politician ID as input. Intuitively, the model tries to learn the consistency of the words written by the politician in a tweet, based on their own past tweets – ergo, does this sound like they wrote it. This has obvious challenges, since we don’t know if politicians write their own tweets, or if those who write their tweets are necessarily consistent.
However, the assumption we go with is that politicians who talk about similar topics should have similar embeddings. This is generally true since similar word distributions are used for similar topics, and if multiple politicians are talking about the same topics, the model will output words from the same distribution. Thus, the function that the model tries to approximate is \(\Phi(P_{i}, w_{j}) = \{0, 1\}\) where \(P_{i}\) is the unique ID of the politician, \(w_{j}\) is a word and the label \(\{0, 1\}\) is decided whether that word \(w_{j}\) occurred in the sampled `K’ words of the tweets that the politician has authored.
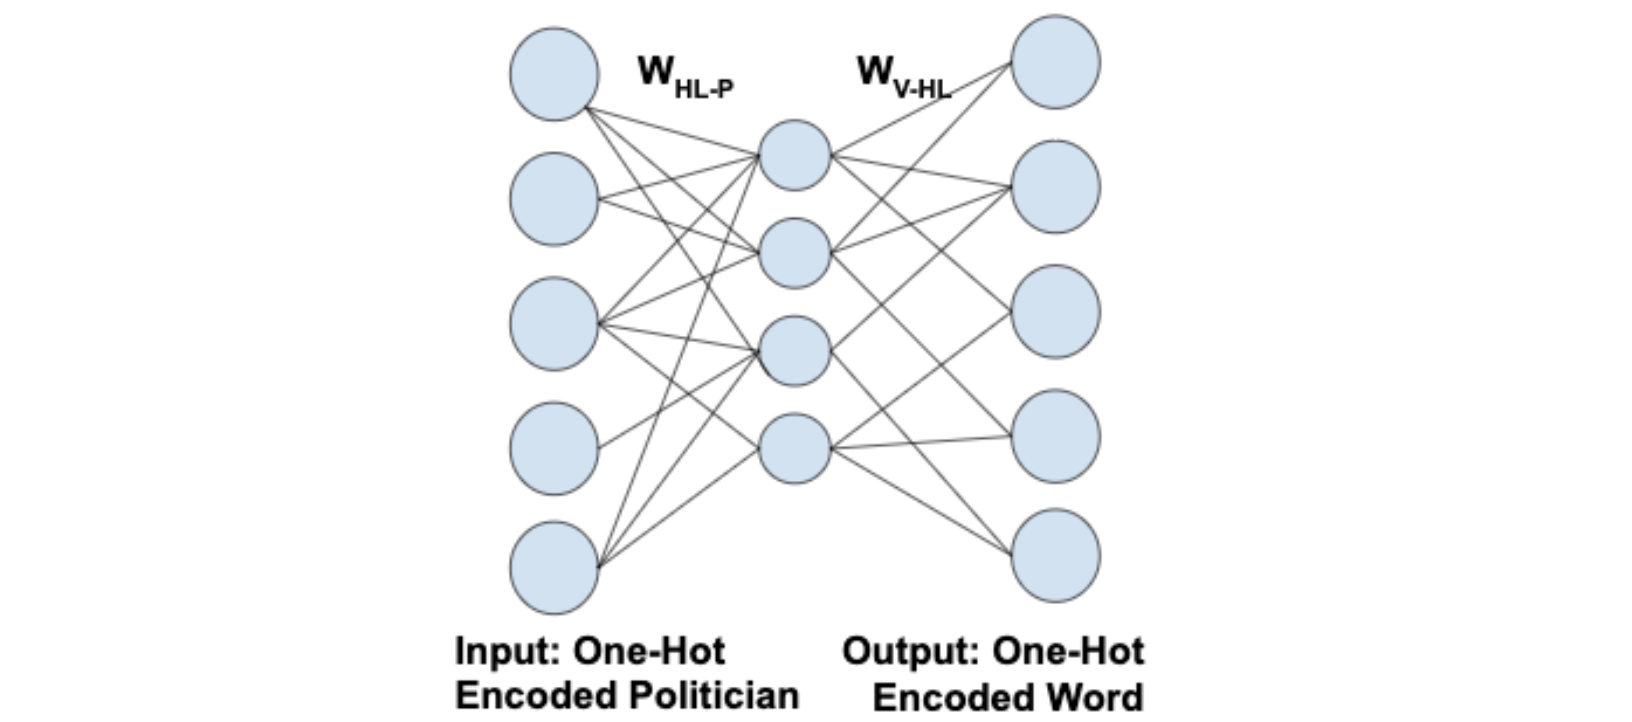
To approximate \(\Phi\) from the given data, we propose to use a shallow neural network. Figure below shows the outline of the neural network architecture. The input layer corresponds to the politicians and is of the size of the number of politicians. Hidden layer is the size of the embedding dimension that is desired. The output layer is for the output words and is of the size of the vocabulary to enable prediction of words for the input politician. The model is trained to maximize the likelihood of prediction of the `K’ words sampled from the tweet. This is stated as follows,
\[\mathcal{L}(\theta) = \frac{1}{M} \frac{1}{K} \sum_{j=1}^{M} \sum_{i=1}^{K} \log( \textit{Pr}(w_{i}, P_{t_{j}}) \mid \theta)\]where \(P_{t_{j}}\) is the politician who is the author of \(t_{j}^{th}\) tweet, \(\textit{Pr}\) is the probability of predicting the word \(w_{i}\) out of the K words sampled from a tweet written by \(P_{t_{j}}\), M is the total number of tweets in the dataset and \(\theta\) denotes the parameters of our model.
Party Prediction Task
To understand whether what a politician writes is influenced by their political party, we conduct an empirical experiment to predict the party of a politician using the learnt embeddings as features in a logistic regression model. A high accuracy on this task indicates a high degree of correlation (and vice versa) between the content posted by politicians and their respective parties.
We create four types of feature vectors per politician using the tweets for the logistic regression classifier - 1) using TF-IDF ([1]) by constructing TF-IDF weights considering each politician as a document of concatenated tweets written by the respective politician; 2) using Word2Vec ([3]) 3) using User-DBOW model ([4, 5]); and 4) using the proposed method. The experiment using TF-IDF is important to understand if the raw word distributions are sufficient enough to predict the parties of politicians, indicating no need for complex embedding methods. We observe that in the case of the USA, TF-IDF based performs very close to the embedding methods. For the compared embedding methods, we also conduct a hyper-parameter sweep over embedding size (50, 100, 200, 300 and 400) and window size (3,5,8). For evaluation purpose, we measure standard classification metrics - Accuracy, Precision, Recall and F1-score (macro).
For our experiments, we use the publicly available Nivaduck dataset ([2]) which contains state and party annotations for political screen names for India (13111 politician accounts) and only state tags for the United States of America (4422 political accounts with 1500 accounts with state annotations). We use all accounts for training the embeddings and creating the TF-IDF corpus.
USA Dataset: For the USA dataset, since party annotation were not available in the Nivaduck dataset ([2]), we use the tagged dataset of Governors, Senators, and Congress from the Civil Service USA data as our labelled instances. We further label some more political accounts to go beyond congressional handles, and our total dataset for this experiment is 598 politicians with 319 democrat and 279 republican accounts. We train a logistic regression on the embeddings with labels as the party and do a 15-fold testing of the data. For training each fold, we randomly sample 100 politicians from each party, and remaining politicians act as the test users.
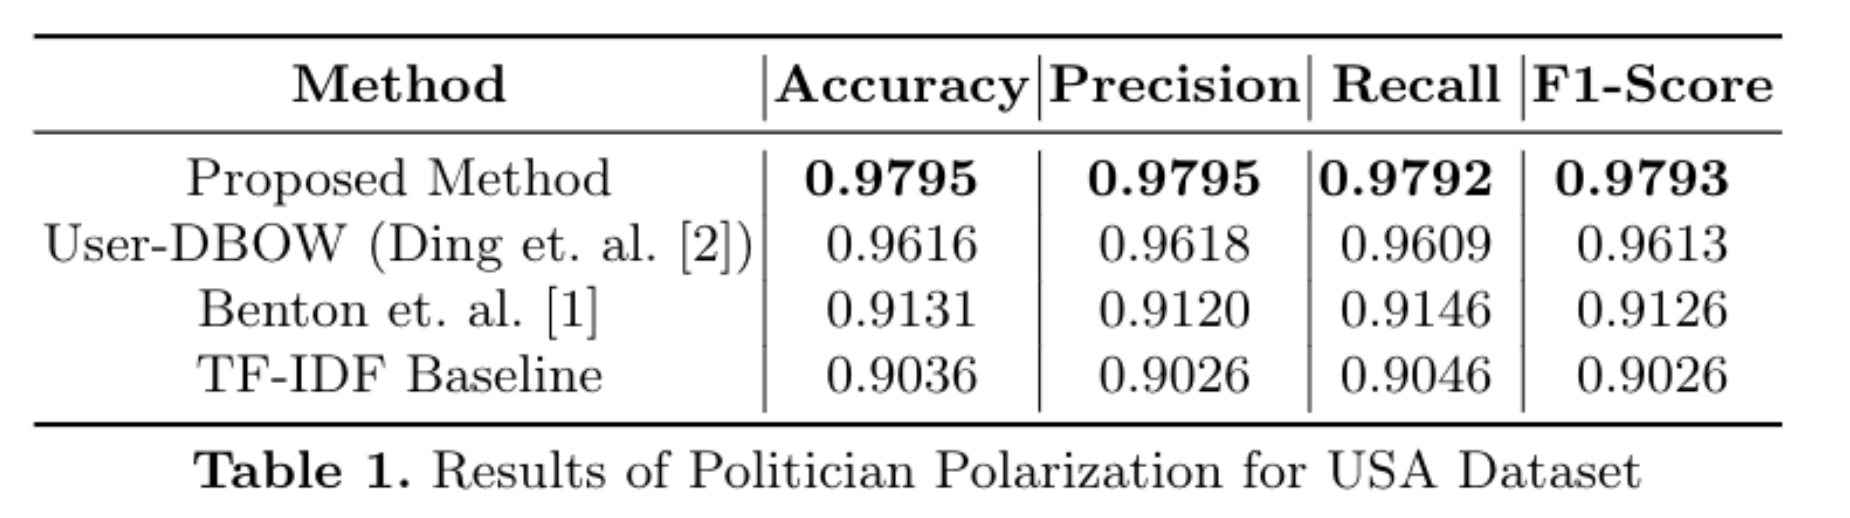
Table 1 shows the average values of metrics across different folds. It can be seen that TF-IDF gives a 90% accuracy, which is improved slightly by the method proposed in [3]. The User-DBOW approach proposed in [4] improves the results significantly by approximately 5% followed by the proposed method, which is able to predict most accurately and has a gain of more than 1.5% over User-DBOW approach. This shows that the correlation between the word distribution and the party of a politician is significant enough that a TF-IDF feature vector with linear classifier can identify it 90% of the time. Interestingly, our model also predicted Janet Mills (Twitter handle: JanetMillsforME) as a democrat, whereas she was wrongly tagged as a republican in the Civil Services USA dataset.
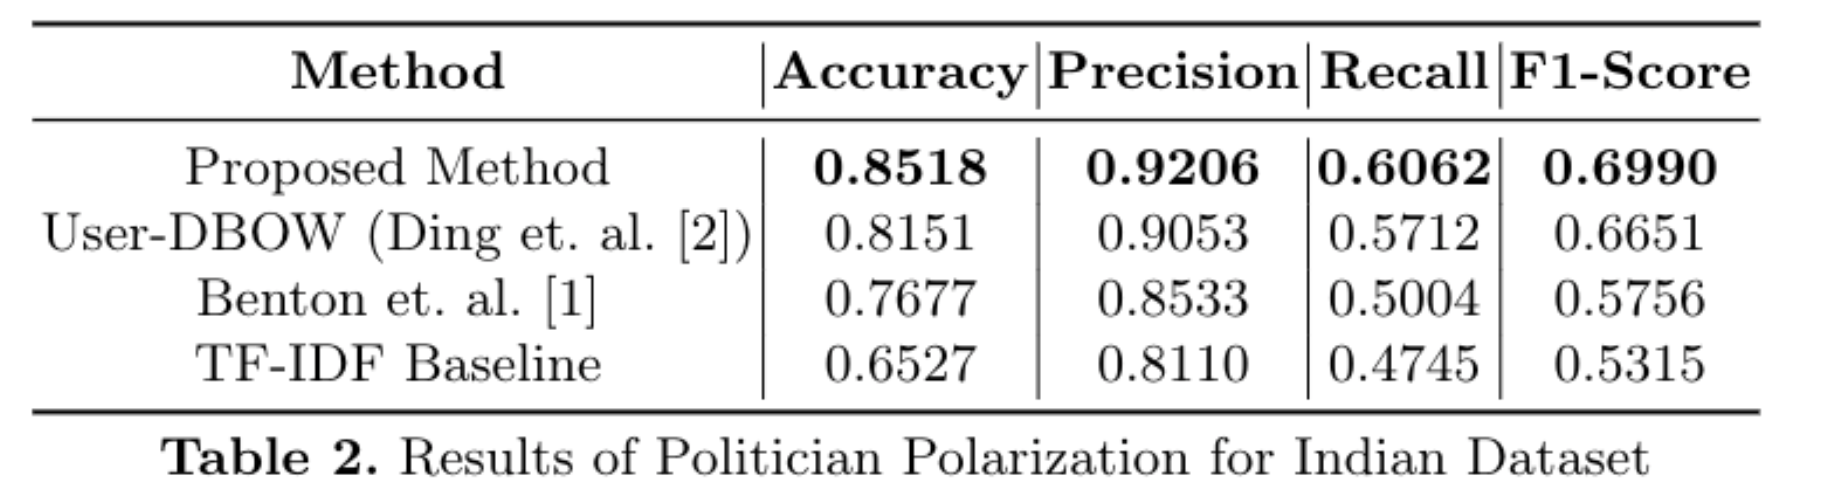
India Dataset: In India, there are multiple parties and, hence, for the Indian dataset, it is a multi-class problem. We consider politicians belonging to the most frequent top-9 parties in the dataset and government handles (which are expected to be neutral). The top-9 parties that we considered are: AAP, AIADMK, BJD, BJP, CPIM, DMK, INC, NCP, and SP. The final filtered dataset contained 11976 handles out of the initially available 13111 handles. Similar to the USA dataset, a logistic regression model is trained with input as the embedding of the politician and output as the party. We do a 15-fold experiment such that for each party at each fold, we select 50 politicians from each party and train the model. Thus, the training dataset is 500 politicians at each fold and test dataset size is 11476. We select a fix number of politicians for training from each party to avoid the problem of class imbalance.
Table 2 shows the results for the India dataset where each metric is averaged across the 15-folds. In the case of India, it can be seen that TF-IDF is not performing as high as the USA, but it is still able to predict the right party ~65% of the time. However, Word2Vec based model [3] significantly improves upon the TF-IDF baseline, and the trend continues with User-DBOW and the proposed method where the proposed method performs better 3.5% and 7.5% compared to User-DBOW [4] and Benton et. al. [3] approaches respectively. This shows that in India, while the embeddings which are learnt via the content of the tweets of politicians are able to predict the parties, the results are not as accurate as of the USA dataset. For example, the F1-Score in Table 2 is 0.699 compared to 0.97 in the case of the USA. This indicates that it is possible that in India, there may be factors beyond the party of a politician which influences their writing on social media, which we discuss in the next section.
Political Affiliation and Topical Communities
From our analysis in the previous section, we can see that the content of the tweets can effectively predict party of the politicians to a great extent, but in the case of India, we still see a large error of approximately 15\% even in the most robust embedding training method. To further understand the topical communities amongst politicians, we employ tSNE \cite{tsne} to reconstruct the higher dimension neighbourhood in two dimensions of the embeddings learnt from the proposed method. Through the 2D plots of these embeddings, we visualize these clusters as a means of helping generate hypotheses on what these clusters indicate.
In the case of India, we observe a distinct pattern of bifurcation between the Northern and the Southern states. In India, the northern states are generally BJP-majority states whereas southern India tends to be dominated by regional and ethnolinguistic parties. Figure below (a) shows the scatter plot of the 2D representations of the learnt embeddings of six Indian states - Tamil Nadu (TN), Karnataka (KA), Madhya Pradesh (MP), Kerala (KL), Uttar Pradesh (UP) and Rajasthan (RJ). It can be seen that MP, UP, and RJ, all dominated by the BJP in the national parliament have significantly overlapping clusters - meaning the three states ``sound-alike”. In contrast, in the southern states of KL, TN, and KA the political clusters are more cohesive. In a nutshell, a politician from UP, MP, or RJ could sound like one from another one of those states, irrespective of which party they belong to. In contrast, in the southern states, even the BJP politicians sound more like others from their state than their party members from neighbouring states. This is an interesting insight into the politics of distinction, and it shows that geography (state) of the politician is also a crucial factor in determining what they write on social media.
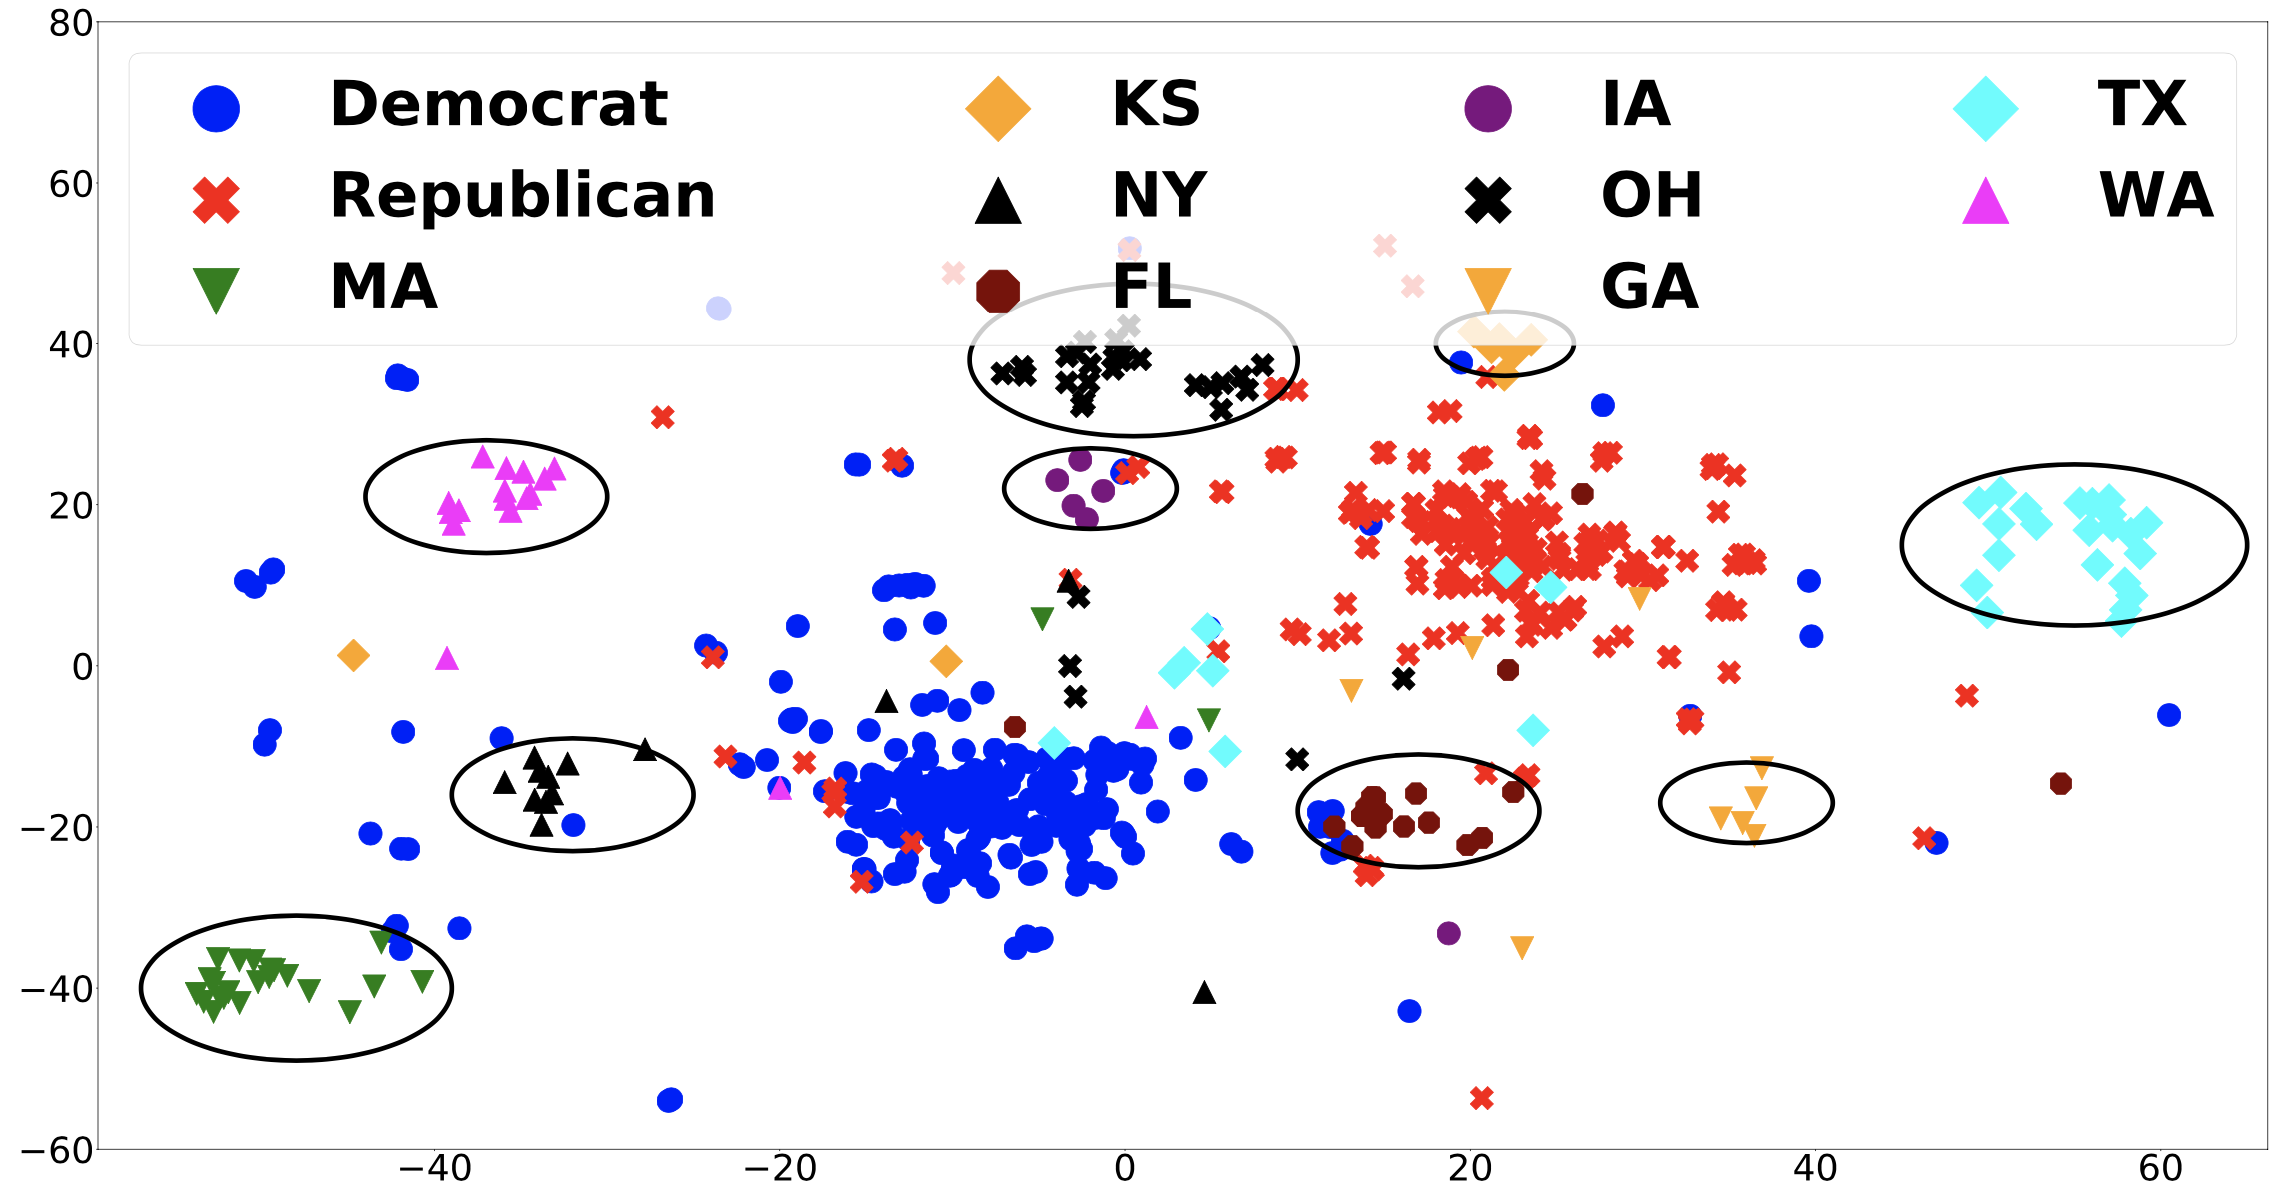
For the USA dataset, we use 1500 politicians according to their states and as well as if they are Congressional, Senatorial, or State legislators’ handles. We then plot Congressional handles according to their political affiliation and other political handles (such as Governors) based on their states. Figure above (b) shows the congressional handles (Democrats in blue circles and Republicans in red crosses) and some political Twitter handles from nine states - three blue states (MA, NY, and WA), three swing states (IA, FL, and OH) and three red states (GA, KS, and TX). It can be seen in the figure that there are two big clusters - red and blue pertaining to Republican congressional handles and democratic congressional handles respectively. Blue states (MA, NY, and WA) are closer to the Blue cluster, and Red states (GA, KS, and TX) are closer to the Red cluster whereas swing states (IA, FL and OH) are somewhere in the middle. This shows a clear party based affinity from state politicians as well as congressional handles. Interestingly, we also observe that within each state, there are clear democratic and republican clusters which explains why the party prediction task had a very high accuracy. The high classification metrics from the party prediction in the previous section, and the corresponding 2D tSNE representations show evidence that for USA politicians, party affiliations could be the driving force of their tweets.
Conclusion and Future Work
In this post, we explore representation learning as a method to answer whether political affiliation of a politician is the driver of their tweets’ content. We propose a new representation learning algorithm and showed that geography plays an equally important roles in defining what a politician writes on Twitter in the case of India and the USA. As a part of future work, we plan to further improve the proposed model by considering sequence models and attention model instead of the current bag of words prediction approach. We also plan on investigating how to include temporal signals to understand if there is topical migration across parties and states.
References
- Term-weighting approaches in automatic text retrieval - Salton, Gerard and Buckley, Christopher
- PoliTwictionary with NivaDuck - A scalable database of political Twitter handles for India and the United States - Panda, Anmol and Gonawela, Andre and Mishra, Dibyendu and Mohapatra, Mugdha Chandrasekaran, Ramgopal and Pal, Joyojeet, (SM Society, 2020)
- Learning multiview embeddings of twitter users - Benton, Adrian and Arora, Raman and Dredze, Mark (ACL 2016)
- Multi-view unsupervised user feature embedding for social media-based substance use prediction - Ding, Tao and Bickel, Warren K and Pan, Shimei (EMNLP 2017)
- Predicting Delay Discounting from Social Media Likes with Unsupervised Feature Learning - Ding, Tao and Bickel, Warren K and Pan, Shimei (ASONAM 2018)